Kenyan vs Colville Seniors Poverty Over the Age of 75
COMPARE
Kenyan
Colville
Seniors Poverty Over the Age of 75
Seniors Poverty Over the Age of 75 Comparison
Kenyans
Colville
11.5%
SENIORS POVERTY OVER THE AGE OF 75
93.9/ 100
METRIC RATING
92nd/ 347
METRIC RANK
15.2%
SENIORS POVERTY OVER THE AGE OF 75
0.0/ 100
METRIC RATING
292nd/ 347
METRIC RANK
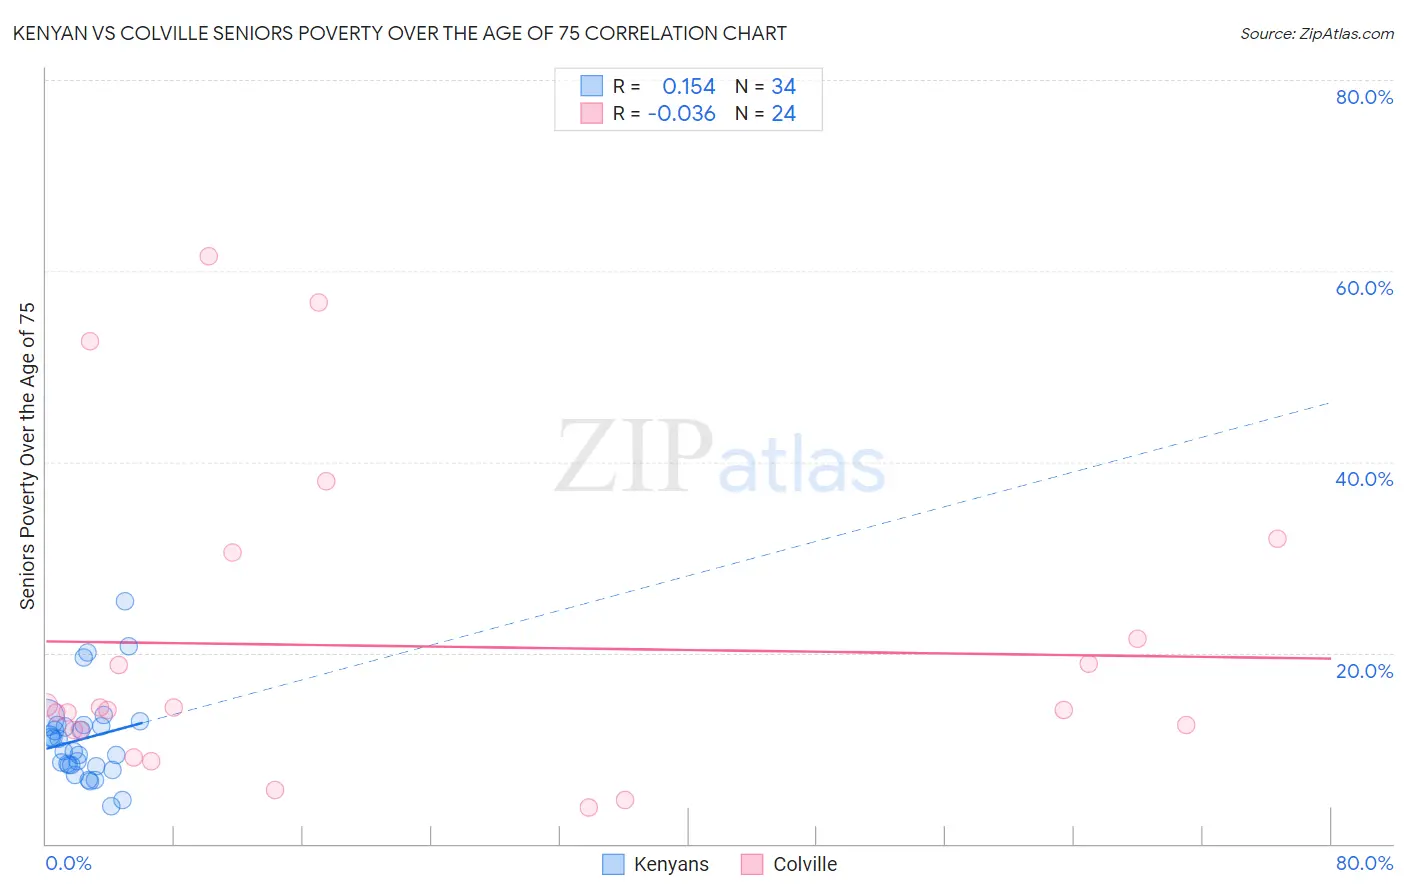
Kenyan vs Colville Seniors Poverty Over the Age of 75 Correlation Chart
The statistical analysis conducted on geographies consisting of 167,184,352 people shows a poor positive correlation between the proportion of Kenyans and poverty level among seniors over the age of 75 in the United States with a correlation coefficient (R) of 0.154 and weighted average of 11.5%. Similarly, the statistical analysis conducted on geographies consisting of 34,564,944 people shows no correlation between the proportion of Colville and poverty level among seniors over the age of 75 in the United States with a correlation coefficient (R) of -0.036 and weighted average of 15.2%, a difference of 32.2%.
Seniors Poverty Over the Age of 75 Correlation Summary
| Measurement | Kenyan | Colville |
| Minimum | 3.9% | 3.7% |
| Maximum | 25.4% | 61.5% |
| Range | 21.5% | 57.8% |
| Mean | 11.0% | 20.7% |
| Median | 10.4% | 14.1% |
| Interquartile 25% (IQ1) | 8.2% | 11.9% |
| Interquartile 75% (IQ3) | 12.4% | 26.0% |
| Interquartile Range (IQR) | 4.2% | 14.1% |
| Standard Deviation (Sample) | 4.6% | 16.3% |
| Standard Deviation (Population) | 4.5% | 15.9% |
Similar Demographics by Seniors Poverty Over the Age of 75
Demographics Similar to Kenyans by Seniors Poverty Over the Age of 75
In terms of seniors poverty over the age of 75, the demographic groups most similar to Kenyans are Immigrants from Germany (11.5%, a difference of 0.070%), Aleut (11.5%, a difference of 0.080%), Immigrants from Sri Lanka (11.5%, a difference of 0.20%), Immigrants from Croatia (11.5%, a difference of 0.23%), and Korean (11.5%, a difference of 0.25%).
| Demographics | Rating | Rank | Seniors Poverty Over the Age of 75 |
| Immigrants | Bulgaria | 94.7 /100 | #85 | Exceptional 11.5% |
| Australians | 94.6 /100 | #86 | Exceptional 11.5% |
| Koreans | 94.5 /100 | #87 | Exceptional 11.5% |
| Immigrants | Croatia | 94.5 /100 | #88 | Exceptional 11.5% |
| Immigrants | Sri Lanka | 94.4 /100 | #89 | Exceptional 11.5% |
| Aleuts | 94.1 /100 | #90 | Exceptional 11.5% |
| Immigrants | Germany | 94.1 /100 | #91 | Exceptional 11.5% |
| Kenyans | 93.9 /100 | #92 | Exceptional 11.5% |
| Immigrants | Poland | 92.9 /100 | #93 | Exceptional 11.6% |
| Creek | 92.7 /100 | #94 | Exceptional 11.6% |
| Immigrants | Bosnia and Herzegovina | 92.6 /100 | #95 | Exceptional 11.6% |
| Immigrants | Sweden | 92.6 /100 | #96 | Exceptional 11.6% |
| Romanians | 92.3 /100 | #97 | Exceptional 11.6% |
| Immigrants | Japan | 91.9 /100 | #98 | Exceptional 11.6% |
| Immigrants | Ethiopia | 91.7 /100 | #99 | Exceptional 11.6% |
Demographics Similar to Colville by Seniors Poverty Over the Age of 75
In terms of seniors poverty over the age of 75, the demographic groups most similar to Colville are Paiute (15.2%, a difference of 0.18%), Immigrants from the Azores (15.2%, a difference of 0.20%), Immigrants from Belize (15.2%, a difference of 0.22%), Apache (15.3%, a difference of 0.40%), and Jamaican (15.1%, a difference of 0.48%).
| Demographics | Rating | Rank | Seniors Poverty Over the Age of 75 |
| Immigrants | Mexico | 0.0 /100 | #285 | Tragic 14.9% |
| Immigrants | Central America | 0.0 /100 | #286 | Tragic 15.0% |
| Immigrants | Guatemala | 0.0 /100 | #287 | Tragic 15.1% |
| Jamaicans | 0.0 /100 | #288 | Tragic 15.1% |
| Immigrants | Belize | 0.0 /100 | #289 | Tragic 15.2% |
| Immigrants | Azores | 0.0 /100 | #290 | Tragic 15.2% |
| Paiute | 0.0 /100 | #291 | Tragic 15.2% |
| Colville | 0.0 /100 | #292 | Tragic 15.2% |
| Apache | 0.0 /100 | #293 | Tragic 15.3% |
| Immigrants | Jamaica | 0.0 /100 | #294 | Tragic 15.3% |
| U.S. Virgin Islanders | 0.0 /100 | #295 | Tragic 15.4% |
| Yuman | 0.0 /100 | #296 | Tragic 15.4% |
| Hondurans | 0.0 /100 | #297 | Tragic 15.4% |
| Natives/Alaskans | 0.0 /100 | #298 | Tragic 15.5% |
| Spanish American Indians | 0.0 /100 | #299 | Tragic 15.5% |