Immigrants from Uzbekistan vs Yup'ik Female Poverty Among 18-24 Year Olds
COMPARE
Immigrants from Uzbekistan
Yup'ik
Female Poverty Among 18-24 Year Olds
Female Poverty Among 18-24 Year Olds Comparison
Immigrants from Uzbekistan
Yup'ik
19.2%
FEMALE POVERTY AMONG 18-24 YEAR OLDS
97.3/ 100
METRIC RATING
108th/ 347
METRIC RANK
27.0%
FEMALE POVERTY AMONG 18-24 YEAR OLDS
0.0/ 100
METRIC RATING
335th/ 347
METRIC RANK
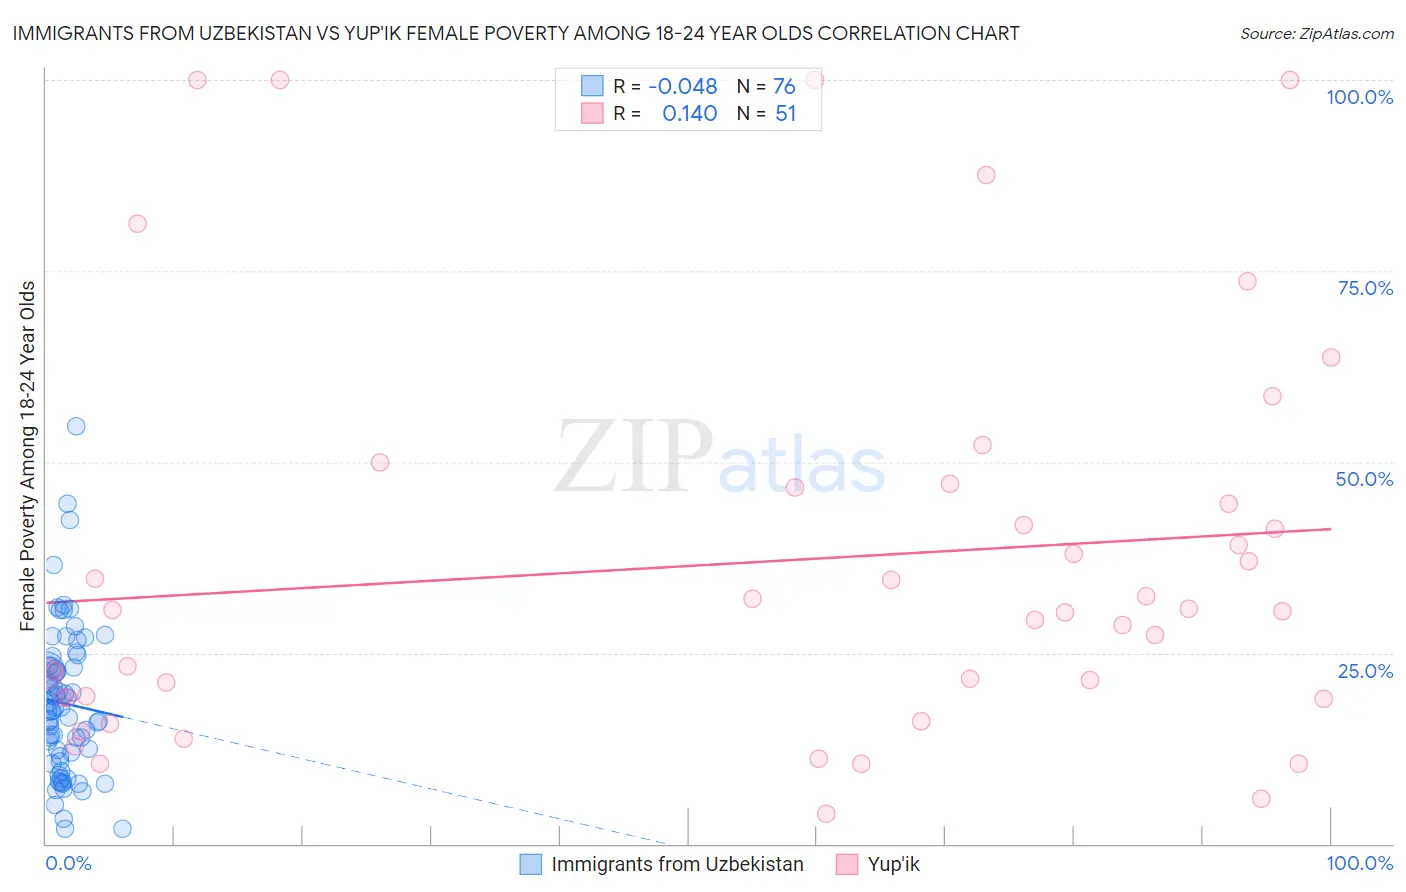
Immigrants from Uzbekistan vs Yup'ik Female Poverty Among 18-24 Year Olds Correlation Chart
The statistical analysis conducted on geographies consisting of 117,709,587 people shows no correlation between the proportion of Immigrants from Uzbekistan and poverty level among females between the ages 18 and 24 in the United States with a correlation coefficient (R) of -0.048 and weighted average of 19.2%. Similarly, the statistical analysis conducted on geographies consisting of 39,755,694 people shows a poor positive correlation between the proportion of Yup'ik and poverty level among females between the ages 18 and 24 in the United States with a correlation coefficient (R) of 0.140 and weighted average of 27.0%, a difference of 40.6%.
Female Poverty Among 18-24 Year Olds Correlation Summary
| Measurement | Immigrants from Uzbekistan | Yup'ik |
| Minimum | 2.0% | 4.0% |
| Maximum | 54.7% | 100.0% |
| Range | 52.8% | 96.0% |
| Mean | 18.4% | 36.8% |
| Median | 17.4% | 30.5% |
| Interquartile 25% (IQ1) | 11.2% | 19.2% |
| Interquartile 75% (IQ3) | 23.2% | 46.7% |
| Interquartile Range (IQR) | 12.0% | 27.5% |
| Standard Deviation (Sample) | 9.8% | 26.1% |
| Standard Deviation (Population) | 9.8% | 25.8% |
Similar Demographics by Female Poverty Among 18-24 Year Olds
Demographics Similar to Immigrants from Uzbekistan by Female Poverty Among 18-24 Year Olds
In terms of female poverty among 18-24 year olds, the demographic groups most similar to Immigrants from Uzbekistan are Immigrants from Syria (19.2%, a difference of 0.080%), Immigrants from Sri Lanka (19.2%, a difference of 0.090%), Laotian (19.2%, a difference of 0.11%), Immigrants from Serbia (19.2%, a difference of 0.12%), and Immigrants from Sierra Leone (19.2%, a difference of 0.24%).
| Demographics | Rating | Rank | Female Poverty Among 18-24 Year Olds |
| Ecuadorians | 98.1 /100 | #101 | Exceptional 19.1% |
| Immigrants | Caribbean | 98.1 /100 | #102 | Exceptional 19.1% |
| Serbians | 98.0 /100 | #103 | Exceptional 19.1% |
| Immigrants | Afghanistan | 98.0 /100 | #104 | Exceptional 19.1% |
| Immigrants | Ecuador | 97.8 /100 | #105 | Exceptional 19.2% |
| Immigrants | Sierra Leone | 97.8 /100 | #106 | Exceptional 19.2% |
| Immigrants | Sri Lanka | 97.5 /100 | #107 | Exceptional 19.2% |
| Immigrants | Uzbekistan | 97.3 /100 | #108 | Exceptional 19.2% |
| Immigrants | Syria | 97.2 /100 | #109 | Exceptional 19.2% |
| Laotians | 97.1 /100 | #110 | Exceptional 19.2% |
| Immigrants | Serbia | 97.1 /100 | #111 | Exceptional 19.2% |
| Immigrants | El Salvador | 96.5 /100 | #112 | Exceptional 19.3% |
| Immigrants | Cameroon | 96.3 /100 | #113 | Exceptional 19.3% |
| Slovenes | 96.2 /100 | #114 | Exceptional 19.3% |
| Immigrants | Hungary | 96.2 /100 | #115 | Exceptional 19.3% |
Demographics Similar to Yup'ik by Female Poverty Among 18-24 Year Olds
In terms of female poverty among 18-24 year olds, the demographic groups most similar to Yup'ik are Pueblo (26.9%, a difference of 0.45%), Immigrants from Yemen (27.5%, a difference of 1.9%), Apache (26.3%, a difference of 2.7%), Houma (26.2%, a difference of 3.2%), and Cheyenne (28.1%, a difference of 4.2%).
| Demographics | Rating | Rank | Female Poverty Among 18-24 Year Olds |
| Natives/Alaskans | 0.0 /100 | #328 | Tragic 25.4% |
| Cajuns | 0.0 /100 | #329 | Tragic 25.7% |
| Immigrants | Somalia | 0.0 /100 | #330 | Tragic 25.7% |
| Chippewa | 0.0 /100 | #331 | Tragic 25.9% |
| Houma | 0.0 /100 | #332 | Tragic 26.2% |
| Apache | 0.0 /100 | #333 | Tragic 26.3% |
| Pueblo | 0.0 /100 | #334 | Tragic 26.9% |
| Yup'ik | 0.0 /100 | #335 | Tragic 27.0% |
| Immigrants | Yemen | 0.0 /100 | #336 | Tragic 27.5% |
| Cheyenne | 0.0 /100 | #337 | Tragic 28.1% |
| Hopi | 0.0 /100 | #338 | Tragic 28.2% |
| Pima | 0.0 /100 | #339 | Tragic 28.4% |
| Sioux | 0.0 /100 | #340 | Tragic 28.6% |
| Colville | 0.0 /100 | #341 | Tragic 29.0% |
| Kiowa | 0.0 /100 | #342 | Tragic 29.2% |