Japanese vs Immigrants from Bolivia Unemployment Among Ages 60 to 64 years
COMPARE
Japanese
Immigrants from Bolivia
Unemployment Among Ages 60 to 64 years
Unemployment Among Ages 60 to 64 years Comparison
Japanese
Immigrants from Bolivia
5.1%
UNEMPLOYMENT AMONG AGES 60 TO 64 YEARS
0.6/ 100
METRIC RATING
257th/ 347
METRIC RANK
4.8%
UNEMPLOYMENT AMONG AGES 60 TO 64 YEARS
69.2/ 100
METRIC RATING
156th/ 347
METRIC RANK
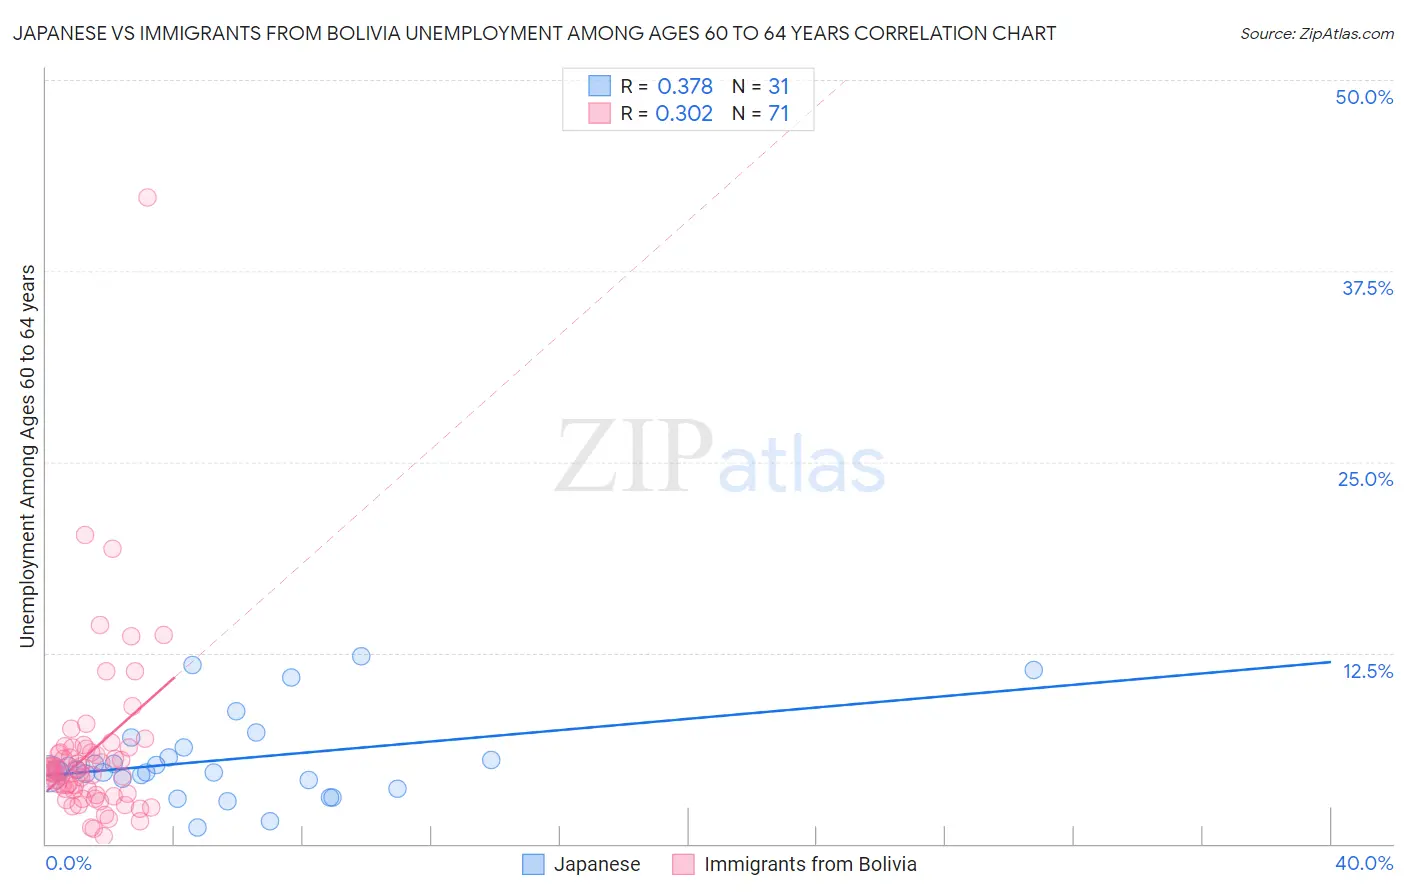
Japanese vs Immigrants from Bolivia Unemployment Among Ages 60 to 64 years Correlation Chart
The statistical analysis conducted on geographies consisting of 235,377,192 people shows a mild positive correlation between the proportion of Japanese and unemployment rate among population between the ages 60 and 64 in the United States with a correlation coefficient (R) of 0.378 and weighted average of 5.1%. Similarly, the statistical analysis conducted on geographies consisting of 152,984,094 people shows a mild positive correlation between the proportion of Immigrants from Bolivia and unemployment rate among population between the ages 60 and 64 in the United States with a correlation coefficient (R) of 0.302 and weighted average of 4.8%, a difference of 5.2%.
Unemployment Among Ages 60 to 64 years Correlation Summary
| Measurement | Japanese | Immigrants from Bolivia |
| Minimum | 1.1% | 0.50% |
| Maximum | 12.3% | 42.3% |
| Range | 11.2% | 41.8% |
| Mean | 5.5% | 6.0% |
| Median | 4.7% | 4.7% |
| Interquartile 25% (IQ1) | 4.2% | 3.3% |
| Interquartile 75% (IQ3) | 6.3% | 6.2% |
| Interquartile Range (IQR) | 2.1% | 2.9% |
| Standard Deviation (Sample) | 2.8% | 5.7% |
| Standard Deviation (Population) | 2.8% | 5.7% |
Similar Demographics by Unemployment Among Ages 60 to 64 years
Demographics Similar to Japanese by Unemployment Among Ages 60 to 64 years
In terms of unemployment among ages 60 to 64 years, the demographic groups most similar to Japanese are Immigrants from Peru (5.1%, a difference of 0.11%), Celtic (5.1%, a difference of 0.16%), Honduran (5.1%, a difference of 0.17%), Estonian (5.1%, a difference of 0.24%), and Costa Rican (5.1%, a difference of 0.25%).
| Demographics | Rating | Rank | Unemployment Among Ages 60 to 64 years |
| Immigrants | Cambodia | 0.9 /100 | #250 | Tragic 5.1% |
| Immigrants | Uruguay | 0.9 /100 | #251 | Tragic 5.1% |
| Immigrants | Switzerland | 0.9 /100 | #252 | Tragic 5.1% |
| Immigrants | China | 0.9 /100 | #253 | Tragic 5.1% |
| Costa Ricans | 0.8 /100 | #254 | Tragic 5.1% |
| Estonians | 0.8 /100 | #255 | Tragic 5.1% |
| Immigrants | Peru | 0.7 /100 | #256 | Tragic 5.1% |
| Japanese | 0.6 /100 | #257 | Tragic 5.1% |
| Celtics | 0.5 /100 | #258 | Tragic 5.1% |
| Hondurans | 0.5 /100 | #259 | Tragic 5.1% |
| Immigrants | Honduras | 0.4 /100 | #260 | Tragic 5.1% |
| Immigrants | Ghana | 0.4 /100 | #261 | Tragic 5.1% |
| Immigrants | Uzbekistan | 0.4 /100 | #262 | Tragic 5.1% |
| Immigrants | Immigrants | 0.4 /100 | #263 | Tragic 5.1% |
| Sioux | 0.3 /100 | #264 | Tragic 5.1% |
Demographics Similar to Immigrants from Bolivia by Unemployment Among Ages 60 to 64 years
In terms of unemployment among ages 60 to 64 years, the demographic groups most similar to Immigrants from Bolivia are Laotian (4.8%, a difference of 0.090%), Filipino (4.8%, a difference of 0.13%), Immigrants from Taiwan (4.8%, a difference of 0.13%), Chilean (4.8%, a difference of 0.15%), and Spanish (4.8%, a difference of 0.15%).
| Demographics | Rating | Rank | Unemployment Among Ages 60 to 64 years |
| Arabs | 78.8 /100 | #149 | Good 4.8% |
| Immigrants | Italy | 78.7 /100 | #150 | Good 4.8% |
| Immigrants | South Africa | 78.5 /100 | #151 | Good 4.8% |
| Americans | 75.7 /100 | #152 | Good 4.8% |
| Bolivians | 75.5 /100 | #153 | Good 4.8% |
| Chileans | 72.6 /100 | #154 | Good 4.8% |
| Filipinos | 72.1 /100 | #155 | Good 4.8% |
| Immigrants | Bolivia | 69.2 /100 | #156 | Good 4.8% |
| Laotians | 66.8 /100 | #157 | Good 4.8% |
| Immigrants | Taiwan | 66.0 /100 | #158 | Good 4.8% |
| Spanish | 65.5 /100 | #159 | Good 4.8% |
| Australians | 65.3 /100 | #160 | Good 4.8% |
| Immigrants | Norway | 65.1 /100 | #161 | Good 4.8% |
| South Africans | 65.1 /100 | #162 | Good 4.8% |
| Immigrants | Belgium | 64.8 /100 | #163 | Good 4.8% |