Italian vs Immigrants from Venezuela Single Father Poverty
COMPARE
Italian
Immigrants from Venezuela
Single Father Poverty
Single Father Poverty Comparison
Italians
Immigrants from Venezuela
17.5%
SINGLE FATHER POVERTY
0.1/ 100
METRIC RATING
273rd/ 347
METRIC RANK
16.4%
SINGLE FATHER POVERTY
31.0/ 100
METRIC RATING
186th/ 347
METRIC RANK
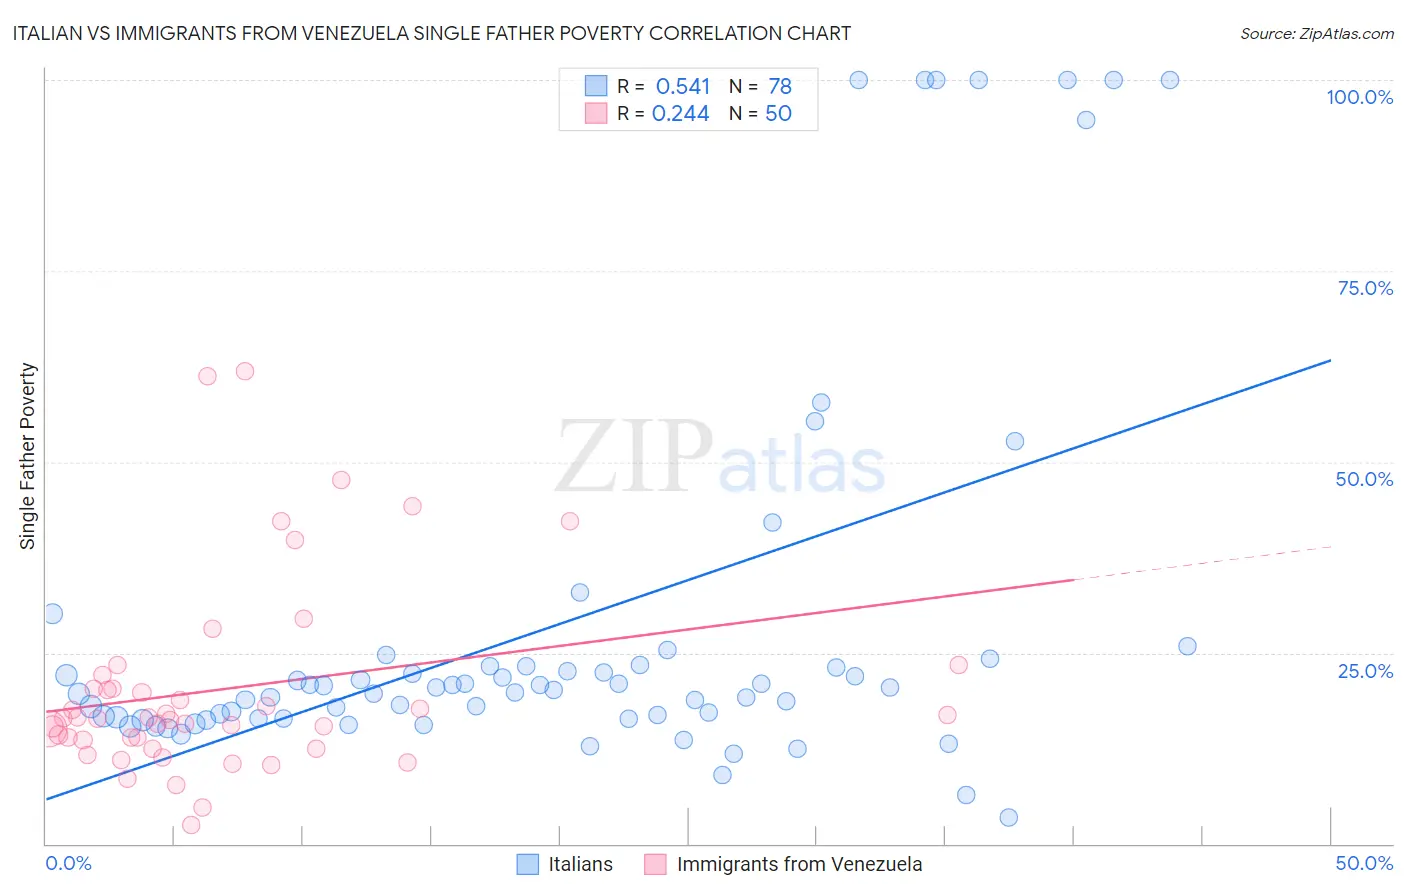
Italian vs Immigrants from Venezuela Single Father Poverty Correlation Chart
The statistical analysis conducted on geographies consisting of 411,059,801 people shows a substantial positive correlation between the proportion of Italians and poverty level among single fathers in the United States with a correlation coefficient (R) of 0.541 and weighted average of 17.5%. Similarly, the statistical analysis conducted on geographies consisting of 236,867,266 people shows a weak positive correlation between the proportion of Immigrants from Venezuela and poverty level among single fathers in the United States with a correlation coefficient (R) of 0.244 and weighted average of 16.4%, a difference of 6.7%.
Single Father Poverty Correlation Summary
| Measurement | Italian | Immigrants from Venezuela |
| Minimum | 3.4% | 2.4% |
| Maximum | 100.0% | 61.9% |
| Range | 96.6% | 59.5% |
| Mean | 28.7% | 20.2% |
| Median | 20.3% | 16.4% |
| Interquartile 25% (IQ1) | 16.4% | 13.6% |
| Interquartile 75% (IQ3) | 23.3% | 20.3% |
| Interquartile Range (IQR) | 6.9% | 6.7% |
| Standard Deviation (Sample) | 25.6% | 12.9% |
| Standard Deviation (Population) | 25.4% | 12.8% |
Similar Demographics by Single Father Poverty
Demographics Similar to Italians by Single Father Poverty
In terms of single father poverty, the demographic groups most similar to Italians are Barbadian (17.5%, a difference of 0.28%), French American Indian (17.4%, a difference of 0.63%), Macedonian (17.7%, a difference of 0.66%), British West Indian (17.7%, a difference of 0.72%), and Indonesian (17.4%, a difference of 0.77%).
| Demographics | Rating | Rank | Single Father Poverty |
| Jamaicans | 0.3 /100 | #266 | Tragic 17.3% |
| Haitians | 0.3 /100 | #267 | Tragic 17.3% |
| Immigrants | Caribbean | 0.3 /100 | #268 | Tragic 17.4% |
| Slavs | 0.3 /100 | #269 | Tragic 17.4% |
| Indonesians | 0.2 /100 | #270 | Tragic 17.4% |
| French American Indians | 0.2 /100 | #271 | Tragic 17.4% |
| Barbadians | 0.1 /100 | #272 | Tragic 17.5% |
| Italians | 0.1 /100 | #273 | Tragic 17.5% |
| Macedonians | 0.1 /100 | #274 | Tragic 17.7% |
| British West Indians | 0.0 /100 | #275 | Tragic 17.7% |
| German Russians | 0.0 /100 | #276 | Tragic 17.7% |
| Lebanese | 0.0 /100 | #277 | Tragic 17.7% |
| Germans | 0.0 /100 | #278 | Tragic 17.7% |
| Iroquois | 0.0 /100 | #279 | Tragic 17.7% |
| Scottish | 0.0 /100 | #280 | Tragic 17.7% |
Demographics Similar to Immigrants from Venezuela by Single Father Poverty
In terms of single father poverty, the demographic groups most similar to Immigrants from Venezuela are Ukrainian (16.4%, a difference of 0.030%), Russian (16.4%, a difference of 0.050%), Latvian (16.5%, a difference of 0.11%), Panamanian (16.4%, a difference of 0.13%), and Immigrants from Burma/Myanmar (16.5%, a difference of 0.16%).
| Demographics | Rating | Rank | Single Father Poverty |
| Serbians | 40.9 /100 | #179 | Average 16.4% |
| Immigrants | Latin America | 37.2 /100 | #180 | Fair 16.4% |
| Immigrants | Western Africa | 36.0 /100 | #181 | Fair 16.4% |
| Immigrants | Italy | 35.7 /100 | #182 | Fair 16.4% |
| Aleuts | 35.3 /100 | #183 | Fair 16.4% |
| Cambodians | 34.6 /100 | #184 | Fair 16.4% |
| Panamanians | 33.6 /100 | #185 | Fair 16.4% |
| Immigrants | Venezuela | 31.0 /100 | #186 | Fair 16.4% |
| Ukrainians | 30.4 /100 | #187 | Fair 16.4% |
| Russians | 30.1 /100 | #188 | Fair 16.4% |
| Latvians | 28.9 /100 | #189 | Fair 16.5% |
| Immigrants | Burma/Myanmar | 28.0 /100 | #190 | Fair 16.5% |
| Immigrants | Guyana | 27.1 /100 | #191 | Fair 16.5% |
| Immigrants | Switzerland | 24.8 /100 | #192 | Fair 16.5% |
| Ecuadorians | 24.5 /100 | #193 | Fair 16.5% |