Israeli vs Slavic Female Poverty Among 18-24 Year Olds
COMPARE
Israeli
Slavic
Female Poverty Among 18-24 Year Olds
Female Poverty Among 18-24 Year Olds Comparison
Israelis
Slavs
20.9%
FEMALE POVERTY AMONG 18-24 YEAR OLDS
4.1/ 100
METRIC RATING
242nd/ 347
METRIC RANK
19.7%
FEMALE POVERTY AMONG 18-24 YEAR OLDS
84.4/ 100
METRIC RATING
143rd/ 347
METRIC RANK
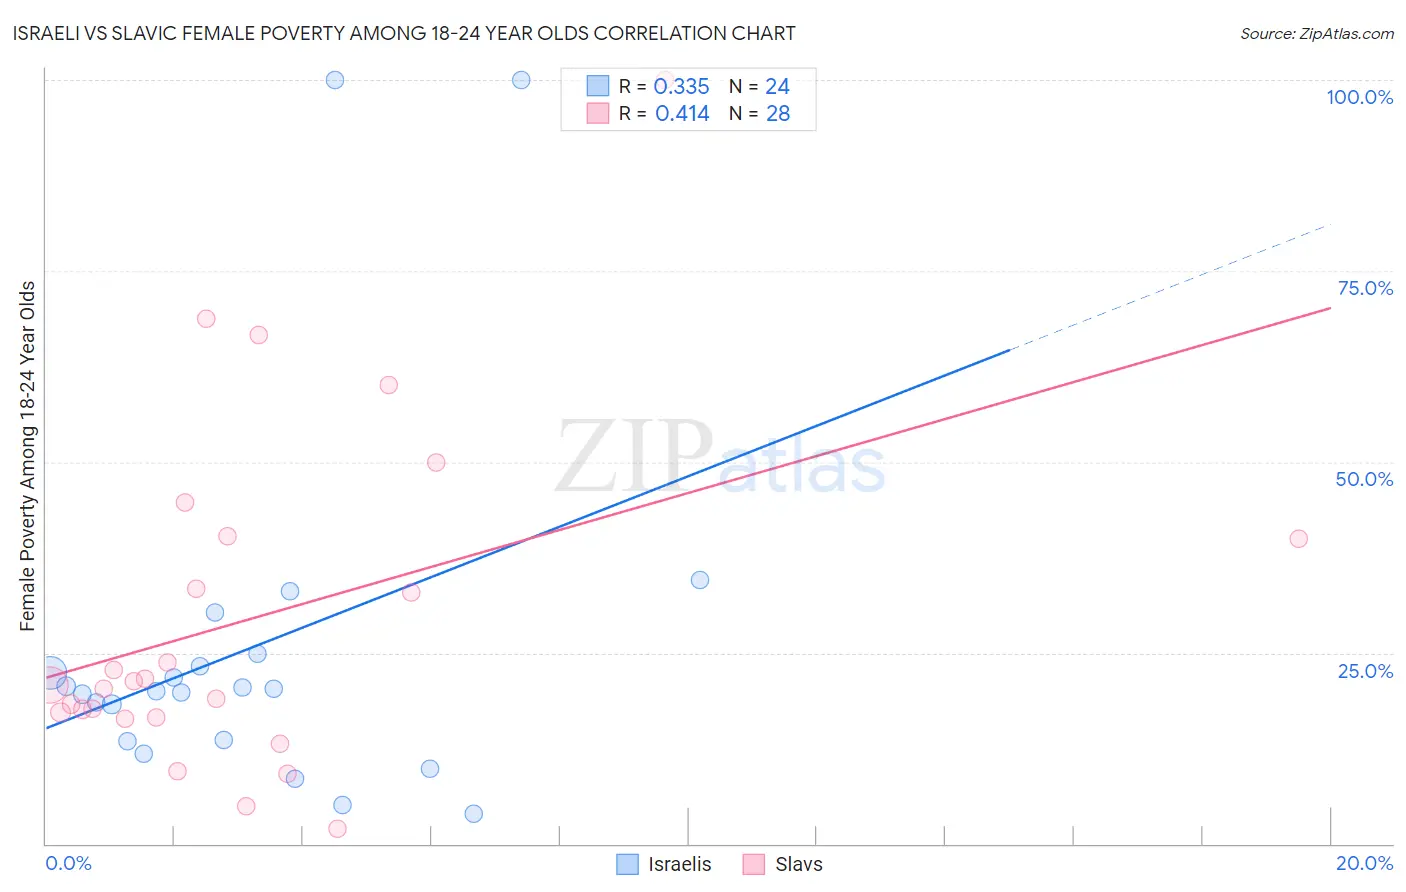
Israeli vs Slavic Female Poverty Among 18-24 Year Olds Correlation Chart
The statistical analysis conducted on geographies consisting of 207,640,312 people shows a mild positive correlation between the proportion of Israelis and poverty level among females between the ages 18 and 24 in the United States with a correlation coefficient (R) of 0.335 and weighted average of 20.9%. Similarly, the statistical analysis conducted on geographies consisting of 265,076,225 people shows a moderate positive correlation between the proportion of Slavs and poverty level among females between the ages 18 and 24 in the United States with a correlation coefficient (R) of 0.414 and weighted average of 19.7%, a difference of 6.0%.
Female Poverty Among 18-24 Year Olds Correlation Summary
| Measurement | Israeli | Slavic |
| Minimum | 4.0% | 2.0% |
| Maximum | 100.0% | 100.0% |
| Range | 96.0% | 98.0% |
| Mean | 25.6% | 29.6% |
| Median | 20.2% | 21.0% |
| Interquartile 25% (IQ1) | 13.5% | 16.9% |
| Interquartile 75% (IQ3) | 24.0% | 40.1% |
| Interquartile Range (IQR) | 10.5% | 23.2% |
| Standard Deviation (Sample) | 24.2% | 22.4% |
| Standard Deviation (Population) | 23.7% | 22.0% |
Similar Demographics by Female Poverty Among 18-24 Year Olds
Demographics Similar to Israelis by Female Poverty Among 18-24 Year Olds
In terms of female poverty among 18-24 year olds, the demographic groups most similar to Israelis are Immigrants from Eritrea (20.9%, a difference of 0.010%), Luxembourger (20.9%, a difference of 0.030%), Immigrants from Guatemala (20.9%, a difference of 0.050%), Immigrants from Singapore (20.9%, a difference of 0.060%), and Scottish (20.9%, a difference of 0.10%).
| Demographics | Rating | Rank | Female Poverty Among 18-24 Year Olds |
| Immigrants | Uganda | 5.1 /100 | #235 | Tragic 20.8% |
| Okinawans | 4.9 /100 | #236 | Tragic 20.8% |
| Scottish | 4.5 /100 | #237 | Tragic 20.9% |
| Immigrants | Singapore | 4.4 /100 | #238 | Tragic 20.9% |
| Immigrants | Guatemala | 4.3 /100 | #239 | Tragic 20.9% |
| Luxembourgers | 4.2 /100 | #240 | Tragic 20.9% |
| Immigrants | Eritrea | 4.2 /100 | #241 | Tragic 20.9% |
| Israelis | 4.1 /100 | #242 | Tragic 20.9% |
| Marshallese | 3.4 /100 | #243 | Tragic 20.9% |
| Immigrants | Thailand | 3.4 /100 | #244 | Tragic 20.9% |
| Aleuts | 3.3 /100 | #245 | Tragic 20.9% |
| Immigrants | Australia | 3.1 /100 | #246 | Tragic 20.9% |
| Immigrants | Africa | 3.0 /100 | #247 | Tragic 21.0% |
| Immigrants | Kenya | 2.5 /100 | #248 | Tragic 21.0% |
| Carpatho Rusyns | 2.5 /100 | #249 | Tragic 21.0% |
Demographics Similar to Slavs by Female Poverty Among 18-24 Year Olds
In terms of female poverty among 18-24 year olds, the demographic groups most similar to Slavs are Panamanian (19.7%, a difference of 0.010%), Immigrants from Northern Africa (19.7%, a difference of 0.030%), Canadian (19.7%, a difference of 0.060%), Immigrants from Bosnia and Herzegovina (19.7%, a difference of 0.080%), and Pennsylvania German (19.7%, a difference of 0.11%).
| Demographics | Rating | Rank | Female Poverty Among 18-24 Year Olds |
| Russians | 91.5 /100 | #136 | Exceptional 19.5% |
| Austrians | 90.7 /100 | #137 | Exceptional 19.5% |
| Immigrants | Morocco | 89.9 /100 | #138 | Excellent 19.6% |
| Indians (Asian) | 88.3 /100 | #139 | Excellent 19.6% |
| Immigrants | Trinidad and Tobago | 85.6 /100 | #140 | Excellent 19.7% |
| Pennsylvania Germans | 85.5 /100 | #141 | Excellent 19.7% |
| Panamanians | 84.6 /100 | #142 | Excellent 19.7% |
| Slavs | 84.4 /100 | #143 | Excellent 19.7% |
| Immigrants | Northern Africa | 84.1 /100 | #144 | Excellent 19.7% |
| Canadians | 83.8 /100 | #145 | Excellent 19.7% |
| Immigrants | Bosnia and Herzegovina | 83.6 /100 | #146 | Excellent 19.7% |
| Immigrants | Austria | 83.1 /100 | #147 | Excellent 19.7% |
| Immigrants | Latin America | 81.3 /100 | #148 | Excellent 19.7% |
| Immigrants | Oceania | 81.2 /100 | #149 | Excellent 19.7% |
| Syrians | 80.2 /100 | #150 | Excellent 19.8% |