Immigrants from South America vs Slavic Female Poverty Among 18-24 Year Olds
COMPARE
Immigrants from South America
Slavic
Female Poverty Among 18-24 Year Olds
Female Poverty Among 18-24 Year Olds Comparison
Immigrants from South America
Slavs
17.9%
FEMALE POVERTY AMONG 18-24 YEAR OLDS
100.0/ 100
METRIC RATING
36th/ 347
METRIC RANK
19.7%
FEMALE POVERTY AMONG 18-24 YEAR OLDS
84.4/ 100
METRIC RATING
143rd/ 347
METRIC RANK
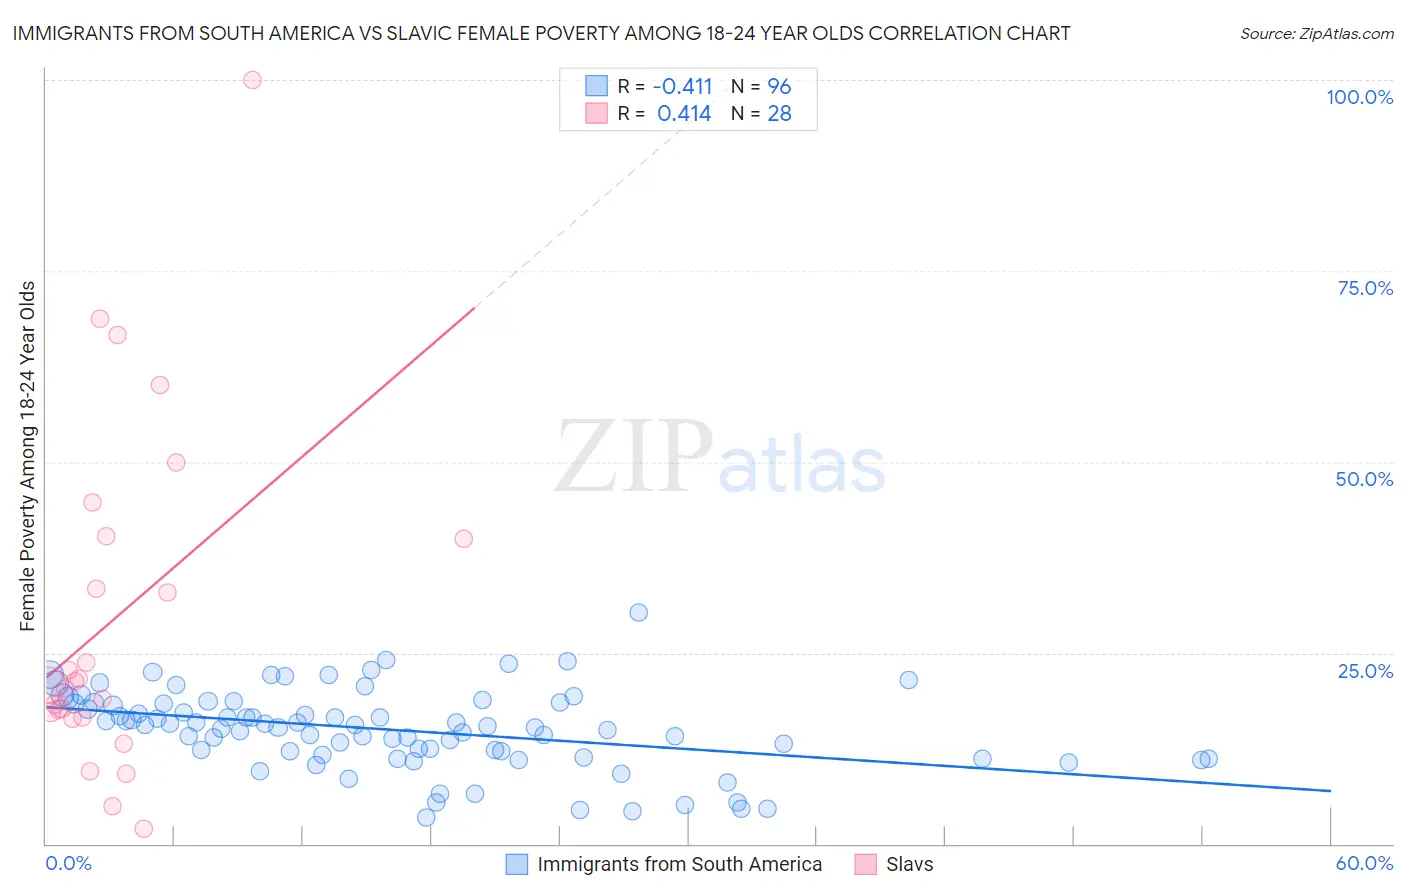
Immigrants from South America vs Slavic Female Poverty Among 18-24 Year Olds Correlation Chart
The statistical analysis conducted on geographies consisting of 468,818,537 people shows a moderate negative correlation between the proportion of Immigrants from South America and poverty level among females between the ages 18 and 24 in the United States with a correlation coefficient (R) of -0.411 and weighted average of 17.9%. Similarly, the statistical analysis conducted on geographies consisting of 265,076,225 people shows a moderate positive correlation between the proportion of Slavs and poverty level among females between the ages 18 and 24 in the United States with a correlation coefficient (R) of 0.414 and weighted average of 19.7%, a difference of 10.0%.
Female Poverty Among 18-24 Year Olds Correlation Summary
| Measurement | Immigrants from South America | Slavic |
| Minimum | 3.5% | 2.0% |
| Maximum | 30.2% | 100.0% |
| Range | 26.7% | 98.0% |
| Mean | 15.0% | 29.6% |
| Median | 15.5% | 21.0% |
| Interquartile 25% (IQ1) | 11.9% | 16.9% |
| Interquartile 75% (IQ3) | 18.4% | 40.1% |
| Interquartile Range (IQR) | 6.5% | 23.2% |
| Standard Deviation (Sample) | 5.2% | 22.4% |
| Standard Deviation (Population) | 5.2% | 22.0% |
Similar Demographics by Female Poverty Among 18-24 Year Olds
Demographics Similar to Immigrants from South America by Female Poverty Among 18-24 Year Olds
In terms of female poverty among 18-24 year olds, the demographic groups most similar to Immigrants from South America are Immigrants from Greece (17.9%, a difference of 0.050%), Immigrants from Croatia (17.9%, a difference of 0.060%), Immigrants from Nicaragua (17.9%, a difference of 0.090%), Native Hawaiian (17.9%, a difference of 0.20%), and Immigrants from Moldova (17.9%, a difference of 0.23%).
| Demographics | Rating | Rank | Female Poverty Among 18-24 Year Olds |
| Portuguese | 100.0 /100 | #29 | Exceptional 17.8% |
| Immigrants | South Eastern Asia | 100.0 /100 | #30 | Exceptional 17.8% |
| Immigrants | Vietnam | 100.0 /100 | #31 | Exceptional 17.8% |
| Immigrants | Moldova | 100.0 /100 | #32 | Exceptional 17.9% |
| Native Hawaiians | 100.0 /100 | #33 | Exceptional 17.9% |
| Immigrants | Nicaragua | 100.0 /100 | #34 | Exceptional 17.9% |
| Immigrants | Greece | 100.0 /100 | #35 | Exceptional 17.9% |
| Immigrants | South America | 100.0 /100 | #36 | Exceptional 17.9% |
| Immigrants | Croatia | 100.0 /100 | #37 | Exceptional 17.9% |
| South Americans | 100.0 /100 | #38 | Exceptional 18.0% |
| Puget Sound Salish | 100.0 /100 | #39 | Exceptional 18.0% |
| Immigrants | Romania | 100.0 /100 | #40 | Exceptional 18.0% |
| Immigrants | Argentina | 100.0 /100 | #41 | Exceptional 18.0% |
| Bulgarians | 100.0 /100 | #42 | Exceptional 18.1% |
| Macedonians | 100.0 /100 | #43 | Exceptional 18.1% |
Demographics Similar to Slavs by Female Poverty Among 18-24 Year Olds
In terms of female poverty among 18-24 year olds, the demographic groups most similar to Slavs are Panamanian (19.7%, a difference of 0.010%), Immigrants from Northern Africa (19.7%, a difference of 0.030%), Canadian (19.7%, a difference of 0.060%), Immigrants from Bosnia and Herzegovina (19.7%, a difference of 0.080%), and Pennsylvania German (19.7%, a difference of 0.11%).
| Demographics | Rating | Rank | Female Poverty Among 18-24 Year Olds |
| Russians | 91.5 /100 | #136 | Exceptional 19.5% |
| Austrians | 90.7 /100 | #137 | Exceptional 19.5% |
| Immigrants | Morocco | 89.9 /100 | #138 | Excellent 19.6% |
| Indians (Asian) | 88.3 /100 | #139 | Excellent 19.6% |
| Immigrants | Trinidad and Tobago | 85.6 /100 | #140 | Excellent 19.7% |
| Pennsylvania Germans | 85.5 /100 | #141 | Excellent 19.7% |
| Panamanians | 84.6 /100 | #142 | Excellent 19.7% |
| Slavs | 84.4 /100 | #143 | Excellent 19.7% |
| Immigrants | Northern Africa | 84.1 /100 | #144 | Excellent 19.7% |
| Canadians | 83.8 /100 | #145 | Excellent 19.7% |
| Immigrants | Bosnia and Herzegovina | 83.6 /100 | #146 | Excellent 19.7% |
| Immigrants | Austria | 83.1 /100 | #147 | Excellent 19.7% |
| Immigrants | Latin America | 81.3 /100 | #148 | Excellent 19.7% |
| Immigrants | Oceania | 81.2 /100 | #149 | Excellent 19.7% |
| Syrians | 80.2 /100 | #150 | Excellent 19.8% |