Ukrainian vs Slavic Female Poverty Among 18-24 Year Olds
COMPARE
Ukrainian
Slavic
Female Poverty Among 18-24 Year Olds
Female Poverty Among 18-24 Year Olds Comparison
Ukrainians
Slavs
19.0%
FEMALE POVERTY AMONG 18-24 YEAR OLDS
98.8/ 100
METRIC RATING
94th/ 347
METRIC RANK
19.7%
FEMALE POVERTY AMONG 18-24 YEAR OLDS
84.4/ 100
METRIC RATING
143rd/ 347
METRIC RANK
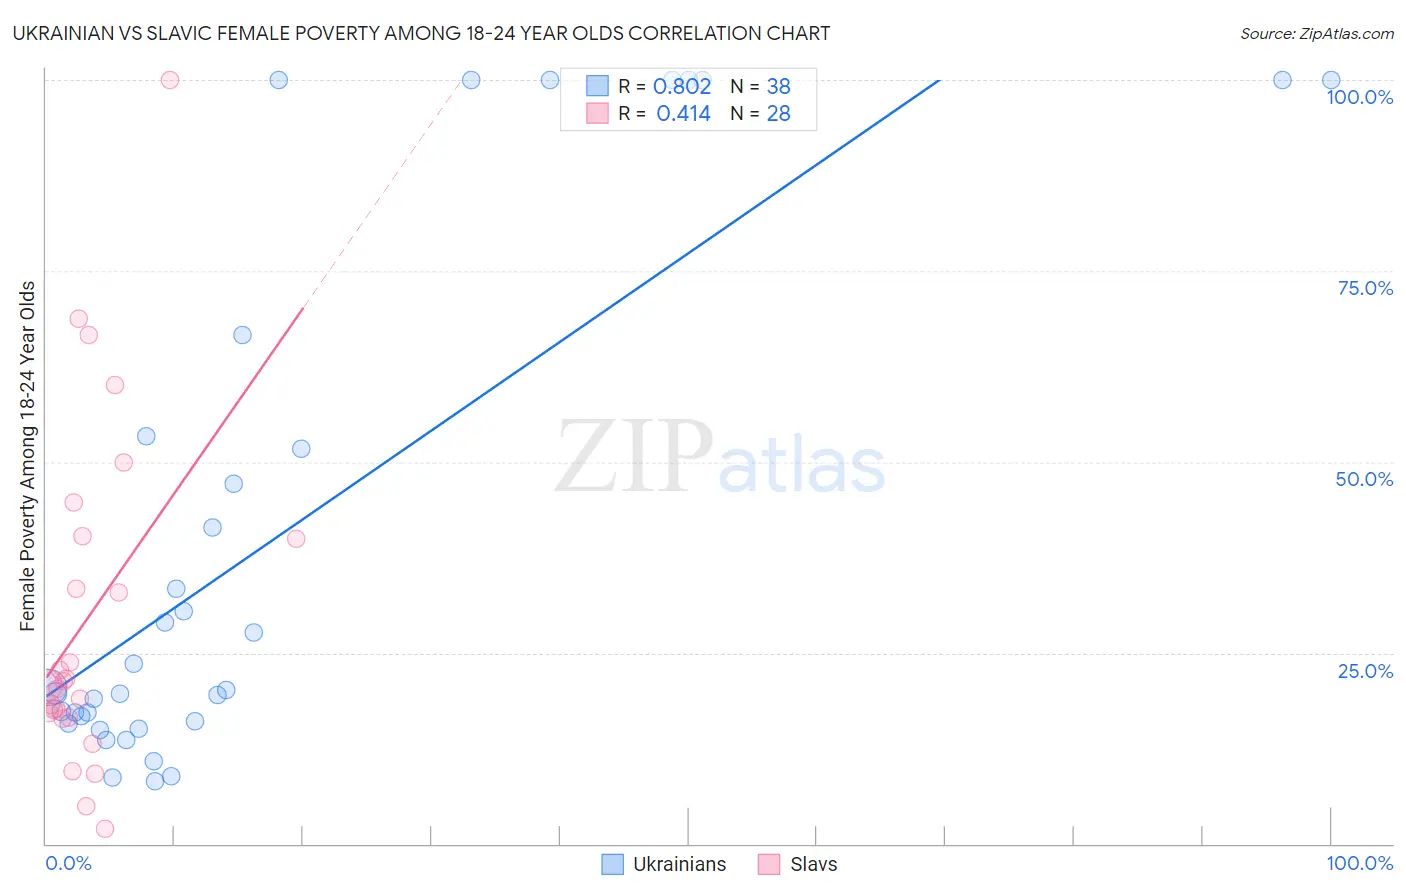
Ukrainian vs Slavic Female Poverty Among 18-24 Year Olds Correlation Chart
The statistical analysis conducted on geographies consisting of 430,534,121 people shows a very strong positive correlation between the proportion of Ukrainians and poverty level among females between the ages 18 and 24 in the United States with a correlation coefficient (R) of 0.802 and weighted average of 19.0%. Similarly, the statistical analysis conducted on geographies consisting of 265,076,225 people shows a moderate positive correlation between the proportion of Slavs and poverty level among females between the ages 18 and 24 in the United States with a correlation coefficient (R) of 0.414 and weighted average of 19.7%, a difference of 3.5%.
Female Poverty Among 18-24 Year Olds Correlation Summary
| Measurement | Ukrainian | Slavic |
| Minimum | 8.2% | 2.0% |
| Maximum | 100.0% | 100.0% |
| Range | 91.8% | 98.0% |
| Mean | 39.9% | 29.6% |
| Median | 20.4% | 21.0% |
| Interquartile 25% (IQ1) | 16.1% | 16.9% |
| Interquartile 75% (IQ3) | 53.4% | 40.1% |
| Interquartile Range (IQR) | 37.3% | 23.2% |
| Standard Deviation (Sample) | 34.0% | 22.4% |
| Standard Deviation (Population) | 33.5% | 22.0% |
Similar Demographics by Female Poverty Among 18-24 Year Olds
Demographics Similar to Ukrainians by Female Poverty Among 18-24 Year Olds
In terms of female poverty among 18-24 year olds, the demographic groups most similar to Ukrainians are Haitian (19.0%, a difference of 0.060%), Guamanian/Chamorro (19.0%, a difference of 0.070%), Filipino (19.0%, a difference of 0.080%), Romanian (19.0%, a difference of 0.13%), and Sierra Leonean (19.0%, a difference of 0.17%).
| Demographics | Rating | Rank | Female Poverty Among 18-24 Year Olds |
| Immigrants | Jamaica | 99.2 /100 | #87 | Exceptional 18.9% |
| Croatians | 99.1 /100 | #88 | Exceptional 19.0% |
| Immigrants | Cabo Verde | 99.0 /100 | #89 | Exceptional 19.0% |
| Afghans | 99.0 /100 | #90 | Exceptional 19.0% |
| Romanians | 98.9 /100 | #91 | Exceptional 19.0% |
| Filipinos | 98.9 /100 | #92 | Exceptional 19.0% |
| Haitians | 98.9 /100 | #93 | Exceptional 19.0% |
| Ukrainians | 98.8 /100 | #94 | Exceptional 19.0% |
| Guamanians/Chamorros | 98.8 /100 | #95 | Exceptional 19.0% |
| Sierra Leoneans | 98.7 /100 | #96 | Exceptional 19.0% |
| Salvadorans | 98.4 /100 | #97 | Exceptional 19.1% |
| Immigrants | Jordan | 98.4 /100 | #98 | Exceptional 19.1% |
| Immigrants | Czechoslovakia | 98.3 /100 | #99 | Exceptional 19.1% |
| Chileans | 98.3 /100 | #100 | Exceptional 19.1% |
| Ecuadorians | 98.1 /100 | #101 | Exceptional 19.1% |
Demographics Similar to Slavs by Female Poverty Among 18-24 Year Olds
In terms of female poverty among 18-24 year olds, the demographic groups most similar to Slavs are Panamanian (19.7%, a difference of 0.010%), Immigrants from Northern Africa (19.7%, a difference of 0.030%), Canadian (19.7%, a difference of 0.060%), Immigrants from Bosnia and Herzegovina (19.7%, a difference of 0.080%), and Pennsylvania German (19.7%, a difference of 0.11%).
| Demographics | Rating | Rank | Female Poverty Among 18-24 Year Olds |
| Russians | 91.5 /100 | #136 | Exceptional 19.5% |
| Austrians | 90.7 /100 | #137 | Exceptional 19.5% |
| Immigrants | Morocco | 89.9 /100 | #138 | Excellent 19.6% |
| Indians (Asian) | 88.3 /100 | #139 | Excellent 19.6% |
| Immigrants | Trinidad and Tobago | 85.6 /100 | #140 | Excellent 19.7% |
| Pennsylvania Germans | 85.5 /100 | #141 | Excellent 19.7% |
| Panamanians | 84.6 /100 | #142 | Excellent 19.7% |
| Slavs | 84.4 /100 | #143 | Excellent 19.7% |
| Immigrants | Northern Africa | 84.1 /100 | #144 | Excellent 19.7% |
| Canadians | 83.8 /100 | #145 | Excellent 19.7% |
| Immigrants | Bosnia and Herzegovina | 83.6 /100 | #146 | Excellent 19.7% |
| Immigrants | Austria | 83.1 /100 | #147 | Excellent 19.7% |
| Immigrants | Latin America | 81.3 /100 | #148 | Excellent 19.7% |
| Immigrants | Oceania | 81.2 /100 | #149 | Excellent 19.7% |
| Syrians | 80.2 /100 | #150 | Excellent 19.8% |