Israeli vs Immigrants from Bolivia Female Poverty Among 18-24 Year Olds
COMPARE
Israeli
Immigrants from Bolivia
Female Poverty Among 18-24 Year Olds
Female Poverty Among 18-24 Year Olds Comparison
Israelis
Immigrants from Bolivia
20.9%
FEMALE POVERTY AMONG 18-24 YEAR OLDS
4.1/ 100
METRIC RATING
242nd/ 347
METRIC RANK
16.7%
FEMALE POVERTY AMONG 18-24 YEAR OLDS
100.0/ 100
METRIC RATING
8th/ 347
METRIC RANK
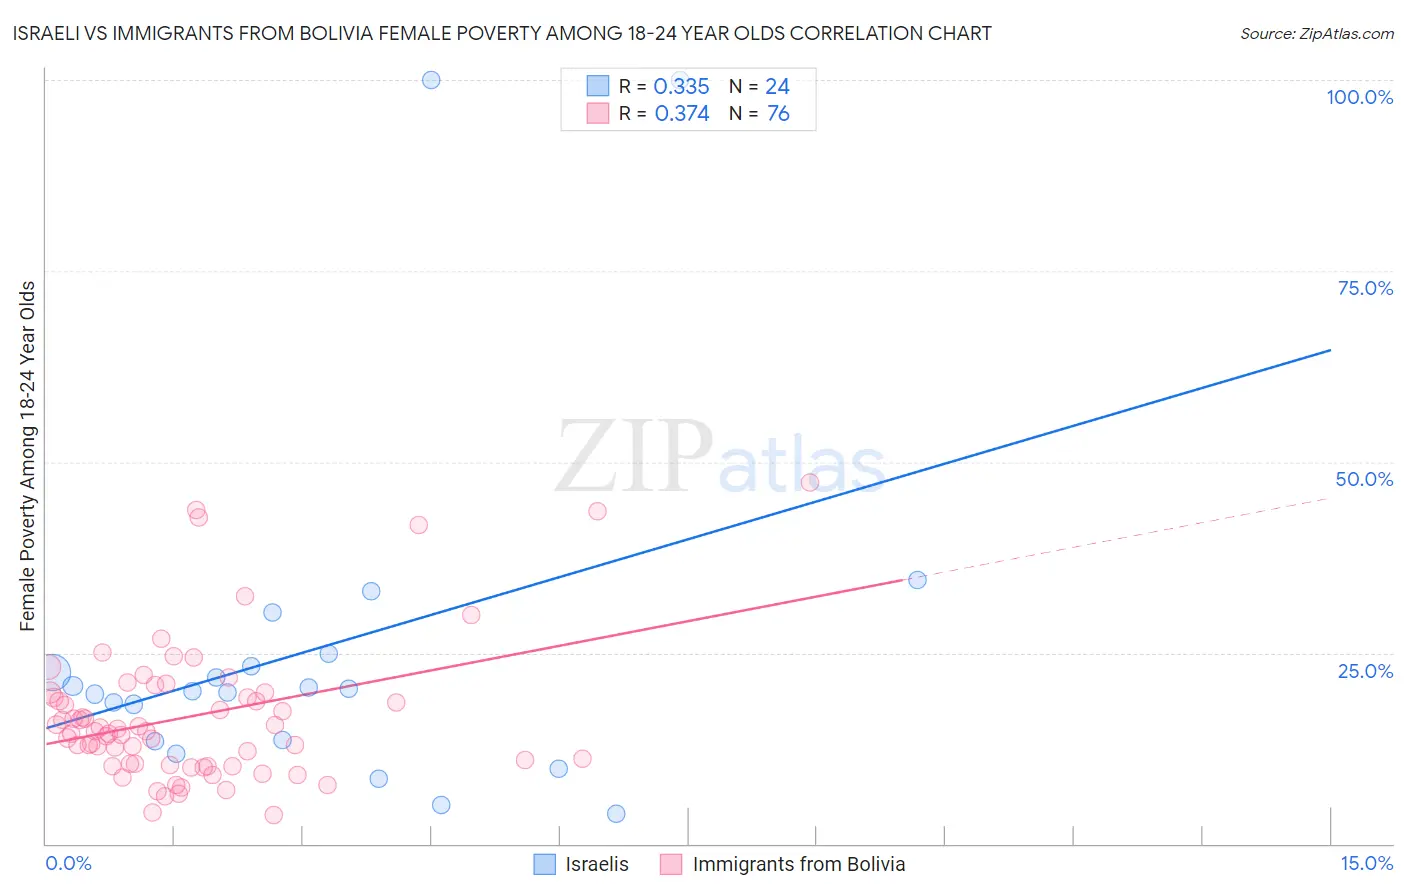
Israeli vs Immigrants from Bolivia Female Poverty Among 18-24 Year Olds Correlation Chart
The statistical analysis conducted on geographies consisting of 207,640,312 people shows a mild positive correlation between the proportion of Israelis and poverty level among females between the ages 18 and 24 in the United States with a correlation coefficient (R) of 0.335 and weighted average of 20.9%. Similarly, the statistical analysis conducted on geographies consisting of 157,283,381 people shows a mild positive correlation between the proportion of Immigrants from Bolivia and poverty level among females between the ages 18 and 24 in the United States with a correlation coefficient (R) of 0.374 and weighted average of 16.7%, a difference of 24.8%.
Female Poverty Among 18-24 Year Olds Correlation Summary
| Measurement | Israeli | Immigrants from Bolivia |
| Minimum | 4.0% | 3.7% |
| Maximum | 100.0% | 47.4% |
| Range | 96.0% | 43.7% |
| Mean | 25.6% | 16.7% |
| Median | 20.2% | 14.7% |
| Interquartile 25% (IQ1) | 13.5% | 10.4% |
| Interquartile 75% (IQ3) | 24.0% | 19.5% |
| Interquartile Range (IQR) | 10.5% | 9.1% |
| Standard Deviation (Sample) | 24.2% | 9.2% |
| Standard Deviation (Population) | 23.7% | 9.2% |
Similar Demographics by Female Poverty Among 18-24 Year Olds
Demographics Similar to Israelis by Female Poverty Among 18-24 Year Olds
In terms of female poverty among 18-24 year olds, the demographic groups most similar to Israelis are Immigrants from Eritrea (20.9%, a difference of 0.010%), Luxembourger (20.9%, a difference of 0.030%), Immigrants from Guatemala (20.9%, a difference of 0.050%), Immigrants from Singapore (20.9%, a difference of 0.060%), and Scottish (20.9%, a difference of 0.10%).
| Demographics | Rating | Rank | Female Poverty Among 18-24 Year Olds |
| Immigrants | Uganda | 5.1 /100 | #235 | Tragic 20.8% |
| Okinawans | 4.9 /100 | #236 | Tragic 20.8% |
| Scottish | 4.5 /100 | #237 | Tragic 20.9% |
| Immigrants | Singapore | 4.4 /100 | #238 | Tragic 20.9% |
| Immigrants | Guatemala | 4.3 /100 | #239 | Tragic 20.9% |
| Luxembourgers | 4.2 /100 | #240 | Tragic 20.9% |
| Immigrants | Eritrea | 4.2 /100 | #241 | Tragic 20.9% |
| Israelis | 4.1 /100 | #242 | Tragic 20.9% |
| Marshallese | 3.4 /100 | #243 | Tragic 20.9% |
| Immigrants | Thailand | 3.4 /100 | #244 | Tragic 20.9% |
| Aleuts | 3.3 /100 | #245 | Tragic 20.9% |
| Immigrants | Australia | 3.1 /100 | #246 | Tragic 20.9% |
| Immigrants | Africa | 3.0 /100 | #247 | Tragic 21.0% |
| Immigrants | Kenya | 2.5 /100 | #248 | Tragic 21.0% |
| Carpatho Rusyns | 2.5 /100 | #249 | Tragic 21.0% |
Demographics Similar to Immigrants from Bolivia by Female Poverty Among 18-24 Year Olds
In terms of female poverty among 18-24 year olds, the demographic groups most similar to Immigrants from Bolivia are Immigrants from the Azores (16.7%, a difference of 0.29%), Immigrants from Philippines (16.7%, a difference of 0.35%), Immigrants from Peru (16.9%, a difference of 0.84%), Immigrants from Portugal (16.5%, a difference of 1.1%), and Korean (16.9%, a difference of 1.2%).
| Demographics | Rating | Rank | Female Poverty Among 18-24 Year Olds |
| Assyrians/Chaldeans/Syriacs | 100.0 /100 | #1 | Exceptional 13.7% |
| Chinese | 100.0 /100 | #2 | Exceptional 16.2% |
| Immigrants | Cuba | 100.0 /100 | #3 | Exceptional 16.4% |
| Immigrants | India | 100.0 /100 | #4 | Exceptional 16.4% |
| Immigrants | Portugal | 100.0 /100 | #5 | Exceptional 16.5% |
| Immigrants | Philippines | 100.0 /100 | #6 | Exceptional 16.7% |
| Immigrants | Azores | 100.0 /100 | #7 | Exceptional 16.7% |
| Immigrants | Bolivia | 100.0 /100 | #8 | Exceptional 16.7% |
| Immigrants | Peru | 100.0 /100 | #9 | Exceptional 16.9% |
| Koreans | 100.0 /100 | #10 | Exceptional 16.9% |
| Thais | 100.0 /100 | #11 | Exceptional 17.0% |
| Immigrants | Pakistan | 100.0 /100 | #12 | Exceptional 17.0% |
| Immigrants | Poland | 100.0 /100 | #13 | Exceptional 17.1% |
| Tongans | 100.0 /100 | #14 | Exceptional 17.1% |
| Cubans | 100.0 /100 | #15 | Exceptional 17.2% |