Israeli vs Immigrants from Croatia 12th Grade, No Diploma
COMPARE
Israeli
Immigrants from Croatia
12th Grade, No Diploma
12th Grade, No Diploma Comparison
Israelis
Immigrants from Croatia
92.1%
12TH GRADE, NO DIPLOMA
96.8/ 100
METRIC RATING
112th/ 347
METRIC RANK
92.3%
12TH GRADE, NO DIPLOMA
98.3/ 100
METRIC RATING
100th/ 347
METRIC RANK
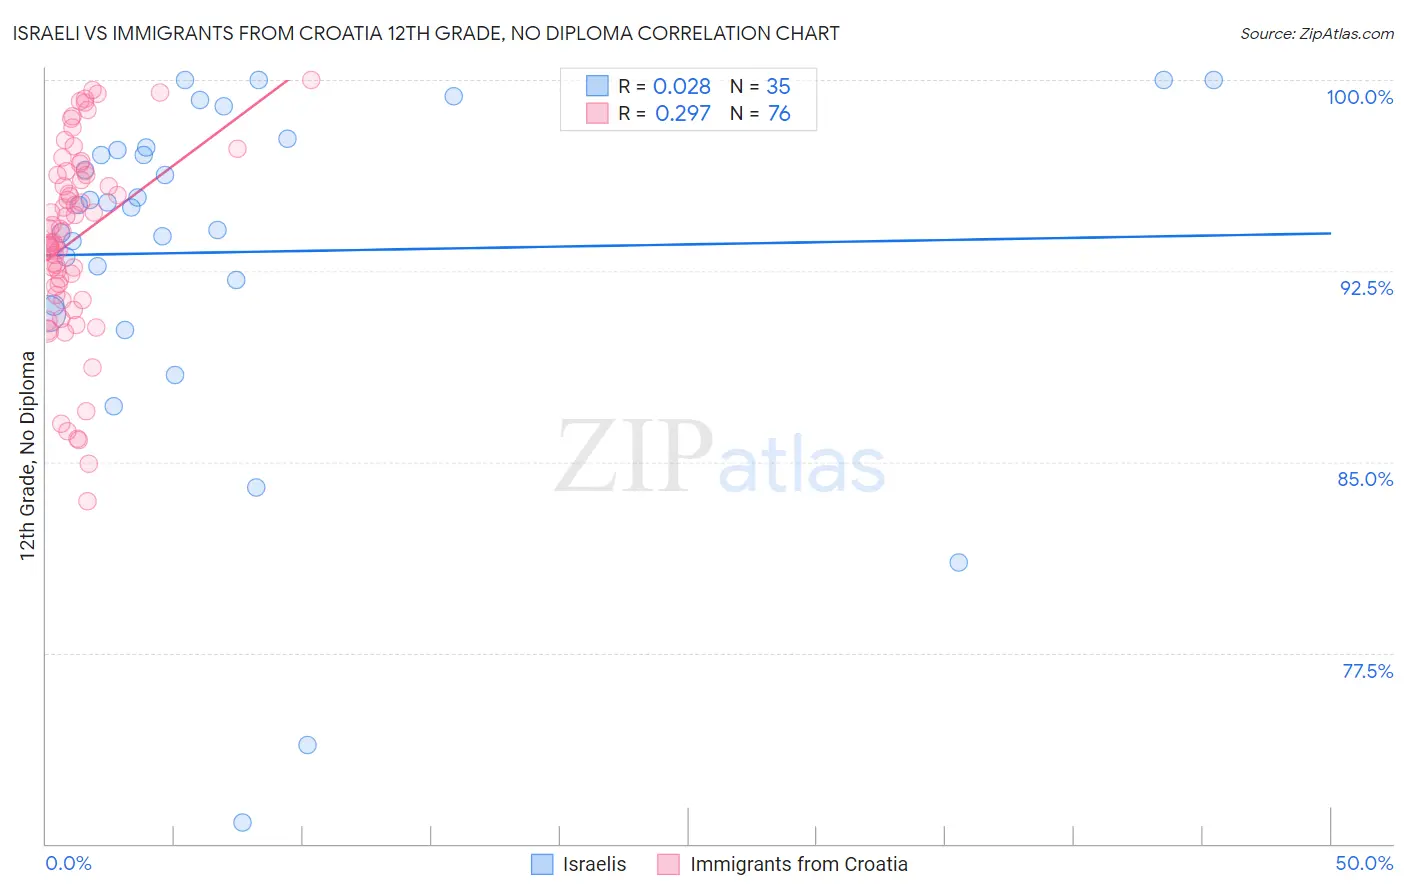
Israeli vs Immigrants from Croatia 12th Grade, No Diploma Correlation Chart
The statistical analysis conducted on geographies consisting of 211,220,151 people shows no correlation between the proportion of Israelis and percentage of population with at least 12th grade (no diploma) education in the United States with a correlation coefficient (R) of 0.028 and weighted average of 92.1%. Similarly, the statistical analysis conducted on geographies consisting of 132,548,119 people shows a weak positive correlation between the proportion of Immigrants from Croatia and percentage of population with at least 12th grade (no diploma) education in the United States with a correlation coefficient (R) of 0.297 and weighted average of 92.3%, a difference of 0.19%.
12th Grade, No Diploma Correlation Summary
| Measurement | Israeli | Immigrants from Croatia |
| Minimum | 70.8% | 83.4% |
| Maximum | 100.0% | 100.0% |
| Range | 29.2% | 16.6% |
| Mean | 93.2% | 93.8% |
| Median | 95.1% | 94.1% |
| Interquartile 25% (IQ1) | 91.2% | 91.7% |
| Interquartile 75% (IQ3) | 97.4% | 96.3% |
| Interquartile Range (IQR) | 6.2% | 4.6% |
| Standard Deviation (Sample) | 6.9% | 3.8% |
| Standard Deviation (Population) | 6.8% | 3.7% |
Demographics Similar to Israelis and Immigrants from Croatia by 12th Grade, No Diploma
In terms of 12th grade, no diploma, the demographic groups most similar to Israelis are Immigrants from Hungary (92.1%, a difference of 0.020%), Palestinian (92.1%, a difference of 0.020%), Immigrants from Greece (92.1%, a difference of 0.020%), Immigrants from Zimbabwe (92.1%, a difference of 0.030%), and Yugoslavian (92.1%, a difference of 0.030%). Similarly, the demographic groups most similar to Immigrants from Croatia are Immigrants from Korea (92.3%, a difference of 0.010%), Celtic (92.3%, a difference of 0.020%), Immigrants from Kuwait (92.3%, a difference of 0.020%), Swiss (92.3%, a difference of 0.020%), and Icelander (92.3%, a difference of 0.030%).
| Demographics | Rating | Rank | 12th Grade, No Diploma |
| Icelanders | 98.5 /100 | #96 | Exceptional 92.3% |
| Celtics | 98.4 /100 | #97 | Exceptional 92.3% |
| Immigrants | Kuwait | 98.4 /100 | #98 | Exceptional 92.3% |
| Immigrants | Korea | 98.3 /100 | #99 | Exceptional 92.3% |
| Immigrants | Croatia | 98.3 /100 | #100 | Exceptional 92.3% |
| Swiss | 98.1 /100 | #101 | Exceptional 92.3% |
| Alaskan Athabascans | 98.1 /100 | #102 | Exceptional 92.3% |
| Immigrants | Norway | 98.1 /100 | #103 | Exceptional 92.3% |
| Lebanese | 97.6 /100 | #104 | Exceptional 92.2% |
| Immigrants | Belarus | 97.4 /100 | #105 | Exceptional 92.2% |
| Immigrants | Russia | 97.3 /100 | #106 | Exceptional 92.2% |
| Syrians | 97.2 /100 | #107 | Exceptional 92.2% |
| Jordanians | 97.2 /100 | #108 | Exceptional 92.2% |
| Immigrants | Hungary | 97.0 /100 | #109 | Exceptional 92.1% |
| Palestinians | 97.0 /100 | #110 | Exceptional 92.1% |
| Immigrants | Greece | 96.9 /100 | #111 | Exceptional 92.1% |
| Israelis | 96.8 /100 | #112 | Exceptional 92.1% |
| Immigrants | Zimbabwe | 96.5 /100 | #113 | Exceptional 92.1% |
| Yugoslavians | 96.5 /100 | #114 | Exceptional 92.1% |
| Immigrants | Sri Lanka | 96.4 /100 | #115 | Exceptional 92.1% |
| Aleuts | 96.3 /100 | #116 | Exceptional 92.1% |