Irish vs Hawaiian Single Father Poverty
COMPARE
Irish
Hawaiian
Single Father Poverty
Single Father Poverty Comparison
Irish
Hawaiians
18.0%
SINGLE FATHER POVERTY
0.0/ 100
METRIC RATING
289th/ 347
METRIC RANK
15.1%
SINGLE FATHER POVERTY
99.9/ 100
METRIC RATING
58th/ 347
METRIC RANK
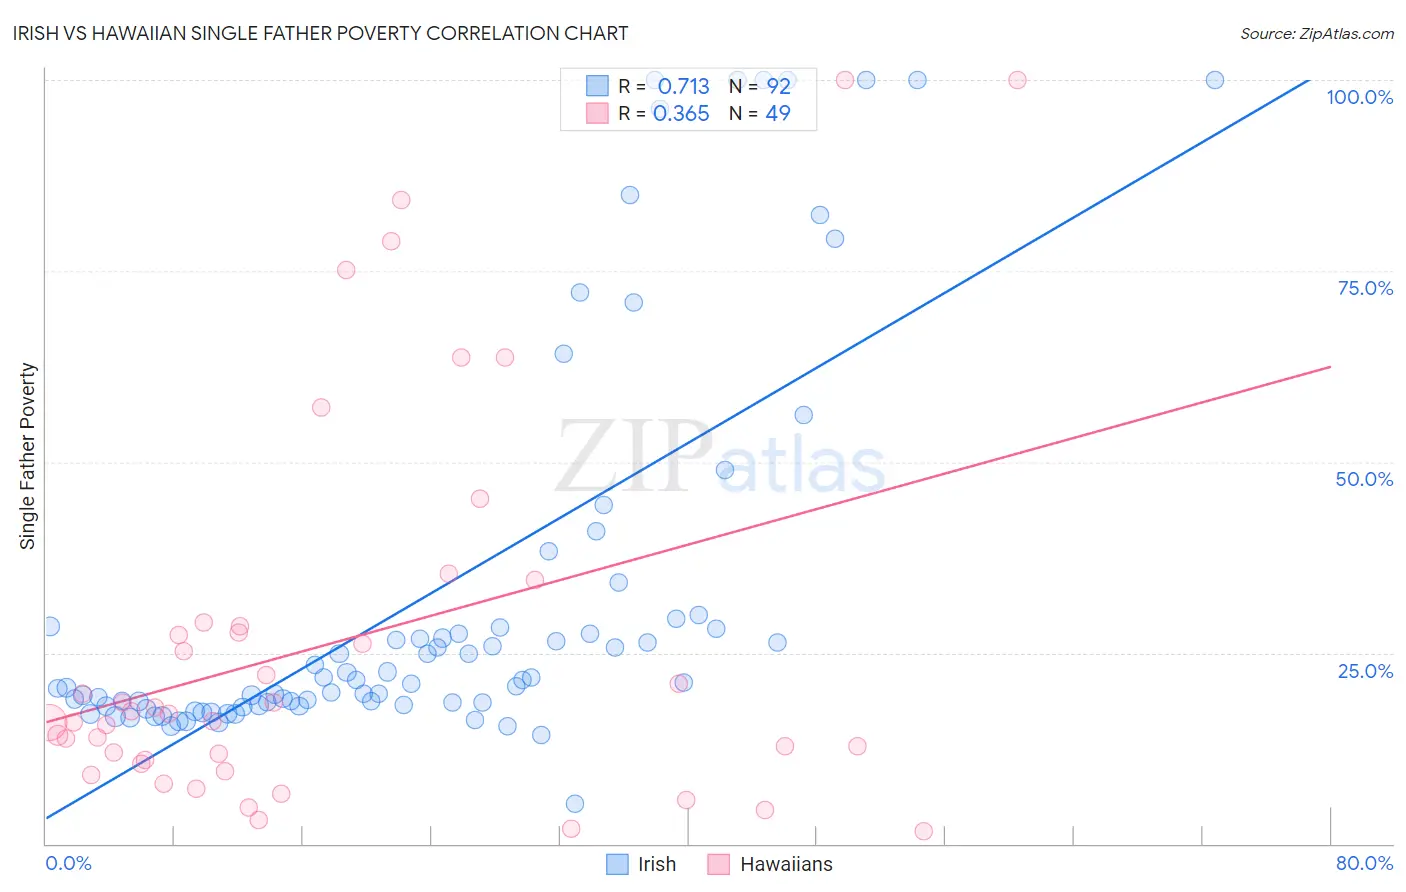
Irish vs Hawaiian Single Father Poverty Correlation Chart
The statistical analysis conducted on geographies consisting of 411,574,452 people shows a strong positive correlation between the proportion of Irish and poverty level among single fathers in the United States with a correlation coefficient (R) of 0.713 and weighted average of 18.0%. Similarly, the statistical analysis conducted on geographies consisting of 272,607,469 people shows a mild positive correlation between the proportion of Hawaiians and poverty level among single fathers in the United States with a correlation coefficient (R) of 0.365 and weighted average of 15.1%, a difference of 19.7%.
Single Father Poverty Correlation Summary
| Measurement | Irish | Hawaiian |
| Minimum | 5.3% | 1.7% |
| Maximum | 100.0% | 100.0% |
| Range | 94.7% | 98.3% |
| Mean | 32.6% | 26.3% |
| Median | 21.3% | 17.0% |
| Interquartile 25% (IQ1) | 18.2% | 10.7% |
| Interquartile 75% (IQ3) | 28.4% | 28.7% |
| Interquartile Range (IQR) | 10.3% | 18.0% |
| Standard Deviation (Sample) | 25.7% | 25.4% |
| Standard Deviation (Population) | 25.6% | 25.2% |
Similar Demographics by Single Father Poverty
Demographics Similar to Irish by Single Father Poverty
In terms of single father poverty, the demographic groups most similar to Irish are West Indian (18.0%, a difference of 0.030%), Alaskan Athabascan (18.1%, a difference of 0.25%), Immigrants from Bahamas (18.1%, a difference of 0.25%), Alaska Native (18.1%, a difference of 0.36%), and U.S. Virgin Islander (18.1%, a difference of 0.39%).
| Demographics | Rating | Rank | Single Father Poverty |
| Dutch | 0.0 /100 | #282 | Tragic 17.8% |
| Alsatians | 0.0 /100 | #283 | Tragic 17.8% |
| Welsh | 0.0 /100 | #284 | Tragic 17.8% |
| Immigrants | Lebanon | 0.0 /100 | #285 | Tragic 17.9% |
| Immigrants | North Macedonia | 0.0 /100 | #286 | Tragic 17.9% |
| Carpatho Rusyns | 0.0 /100 | #287 | Tragic 18.0% |
| Bahamians | 0.0 /100 | #288 | Tragic 18.0% |
| Irish | 0.0 /100 | #289 | Tragic 18.0% |
| West Indians | 0.0 /100 | #290 | Tragic 18.0% |
| Alaskan Athabascans | 0.0 /100 | #291 | Tragic 18.1% |
| Immigrants | Bahamas | 0.0 /100 | #292 | Tragic 18.1% |
| Alaska Natives | 0.0 /100 | #293 | Tragic 18.1% |
| U.S. Virgin Islanders | 0.0 /100 | #294 | Tragic 18.1% |
| Yakama | 0.0 /100 | #295 | Tragic 18.1% |
| Seminole | 0.0 /100 | #296 | Tragic 18.1% |
Demographics Similar to Hawaiians by Single Father Poverty
In terms of single father poverty, the demographic groups most similar to Hawaiians are Laotian (15.1%, a difference of 0.060%), Guamanian/Chamorro (15.1%, a difference of 0.10%), Immigrants from Laos (15.1%, a difference of 0.14%), Immigrants from Bulgaria (15.0%, a difference of 0.42%), and Immigrants from Uzbekistan (15.0%, a difference of 0.47%).
| Demographics | Rating | Rank | Single Father Poverty |
| Immigrants | Pakistan | 99.9 /100 | #51 | Exceptional 15.0% |
| Immigrants | El Salvador | 99.9 /100 | #52 | Exceptional 15.0% |
| Immigrants | Kenya | 99.9 /100 | #53 | Exceptional 15.0% |
| Immigrants | Uzbekistan | 99.9 /100 | #54 | Exceptional 15.0% |
| Immigrants | Bulgaria | 99.9 /100 | #55 | Exceptional 15.0% |
| Immigrants | Laos | 99.9 /100 | #56 | Exceptional 15.1% |
| Laotians | 99.9 /100 | #57 | Exceptional 15.1% |
| Hawaiians | 99.9 /100 | #58 | Exceptional 15.1% |
| Guamanians/Chamorros | 99.9 /100 | #59 | Exceptional 15.1% |
| Puget Sound Salish | 99.8 /100 | #60 | Exceptional 15.2% |
| Immigrants | Bosnia and Herzegovina | 99.8 /100 | #61 | Exceptional 15.2% |
| Immigrants | Armenia | 99.8 /100 | #62 | Exceptional 15.2% |
| Immigrants | Sweden | 99.8 /100 | #63 | Exceptional 15.2% |
| Bangladeshis | 99.8 /100 | #64 | Exceptional 15.2% |
| Immigrants | Malaysia | 99.8 /100 | #65 | Exceptional 15.2% |