Immigrants from North Macedonia vs Ethiopian Poverty
COMPARE
Immigrants from North Macedonia
Ethiopian
Poverty
Poverty Comparison
Immigrants from North Macedonia
Ethiopians
10.6%
POVERTY
99.7/ 100
METRIC RATING
20th/ 347
METRIC RANK
12.2%
POVERTY
59.1/ 100
METRIC RATING
162nd/ 347
METRIC RANK
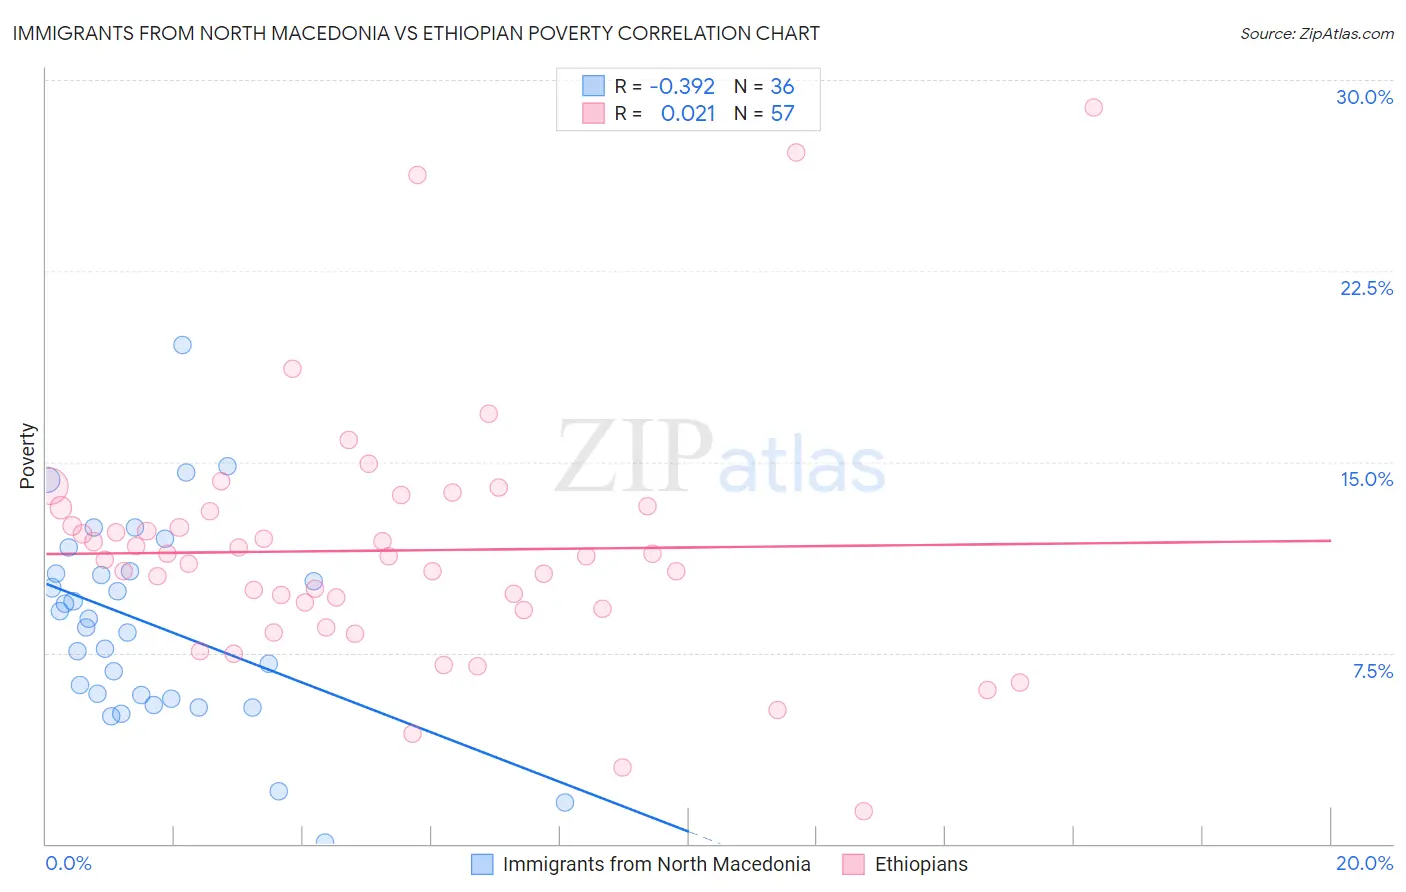
Immigrants from North Macedonia vs Ethiopian Poverty Correlation Chart
The statistical analysis conducted on geographies consisting of 74,289,805 people shows a mild negative correlation between the proportion of Immigrants from North Macedonia and poverty level in the United States with a correlation coefficient (R) of -0.392 and weighted average of 10.6%. Similarly, the statistical analysis conducted on geographies consisting of 223,124,419 people shows no correlation between the proportion of Ethiopians and poverty level in the United States with a correlation coefficient (R) of 0.021 and weighted average of 12.2%, a difference of 15.5%.
Poverty Correlation Summary
| Measurement | Immigrants from North Macedonia | Ethiopian |
| Minimum | 0.071% | 1.3% |
| Maximum | 19.6% | 28.9% |
| Range | 19.5% | 27.7% |
| Mean | 8.6% | 11.5% |
| Median | 8.7% | 11.3% |
| Interquartile 25% (IQ1) | 5.8% | 9.2% |
| Interquartile 75% (IQ3) | 10.7% | 13.1% |
| Interquartile Range (IQR) | 4.9% | 3.9% |
| Standard Deviation (Sample) | 4.0% | 5.0% |
| Standard Deviation (Population) | 3.9% | 4.9% |
Similar Demographics by Poverty
Demographics Similar to Immigrants from North Macedonia by Poverty
In terms of poverty, the demographic groups most similar to Immigrants from North Macedonia are Luxembourger (10.6%, a difference of 0.080%), Immigrants from Scotland (10.6%, a difference of 0.11%), Eastern European (10.6%, a difference of 0.24%), Swedish (10.6%, a difference of 0.34%), and Italian (10.6%, a difference of 0.39%).
| Demographics | Rating | Rank | Poverty |
| Immigrants | Hong Kong | 99.8 /100 | #13 | Exceptional 10.4% |
| Immigrants | Bolivia | 99.8 /100 | #14 | Exceptional 10.4% |
| Bolivians | 99.8 /100 | #15 | Exceptional 10.4% |
| Lithuanians | 99.8 /100 | #16 | Exceptional 10.5% |
| Norwegians | 99.8 /100 | #17 | Exceptional 10.5% |
| Latvians | 99.8 /100 | #18 | Exceptional 10.5% |
| Immigrants | Scotland | 99.7 /100 | #19 | Exceptional 10.6% |
| Immigrants | North Macedonia | 99.7 /100 | #20 | Exceptional 10.6% |
| Luxembourgers | 99.7 /100 | #21 | Exceptional 10.6% |
| Eastern Europeans | 99.7 /100 | #22 | Exceptional 10.6% |
| Swedes | 99.7 /100 | #23 | Exceptional 10.6% |
| Italians | 99.7 /100 | #24 | Exceptional 10.6% |
| Croatians | 99.6 /100 | #25 | Exceptional 10.6% |
| Burmese | 99.6 /100 | #26 | Exceptional 10.7% |
| Immigrants | Northern Europe | 99.6 /100 | #27 | Exceptional 10.7% |
Demographics Similar to Ethiopians by Poverty
In terms of poverty, the demographic groups most similar to Ethiopians are Immigrants from Fiji (12.2%, a difference of 0.010%), Immigrants from Ethiopia (12.2%, a difference of 0.050%), Colombian (12.2%, a difference of 0.12%), Immigrants from Nepal (12.2%, a difference of 0.13%), and Immigrants from Albania (12.2%, a difference of 0.13%).
| Demographics | Rating | Rank | Poverty |
| Hungarians | 63.6 /100 | #155 | Good 12.2% |
| Scotch-Irish | 62.6 /100 | #156 | Good 12.2% |
| Costa Ricans | 62.2 /100 | #157 | Good 12.2% |
| Taiwanese | 61.8 /100 | #158 | Good 12.2% |
| Pennsylvania Germans | 60.8 /100 | #159 | Good 12.2% |
| Immigrants | Nepal | 60.4 /100 | #160 | Good 12.2% |
| Immigrants | Fiji | 59.1 /100 | #161 | Average 12.2% |
| Ethiopians | 59.1 /100 | #162 | Average 12.2% |
| Immigrants | Ethiopia | 58.6 /100 | #163 | Average 12.2% |
| Colombians | 57.8 /100 | #164 | Average 12.2% |
| Immigrants | Albania | 57.7 /100 | #165 | Average 12.2% |
| Venezuelans | 56.9 /100 | #166 | Average 12.2% |
| Immigrants | Chile | 56.7 /100 | #167 | Average 12.2% |
| Immigrants | Venezuela | 56.5 /100 | #168 | Average 12.2% |
| Whites/Caucasians | 55.4 /100 | #169 | Average 12.3% |