Irish vs Arapaho Child Poverty Among Boys Under 16

COMPARE

Irish
Race
Ancestry
AfghanAfricanAlaska NativeAlaskan AthabascanAlbanianAleutAlsatianAmericanApacheArabArgentineanArmenianAssyrian/Chaldean/SyriacAustralianAustrianBahamianBangladeshiBarbadianBasqueBelgianBelizeanBermudanBhutaneseBlackfeetBolivianBrazilianBritishBritish West IndianBulgarianBurmeseCajunCambodianCanadianCape VerdeanCarpatho RusynCelticCentral AmericanCentral American IndianCherokeeCheyenneChickasawChileanChineseChippewaChoctawColombianColvilleComancheCosta RicanCreeCreekCroatianCrowCubanCypriotCzechCzechoslovakianDanishDelawareDominicanDutchDutch West IndianEastern EuropeanEcuadorianEgyptianEnglishEstonianEthiopianEuropeanFijianFilipinoFinnishFrenchFrench American IndianFrench CanadianGermanGerman RussianGhanaianGreekGuamanian/ChamorroGuatemalanGuyaneseHaitianHmongHonduranHopiHoumaHungarianIcelanderIndian (Asian)IndonesianInupiatIranianIraqiIrishIroquoisIsraeliItalianJamaicanJapaneseJordanianKenyanKiowaKoreanLaotianLatvianLebaneseLiberianLithuanianLumbeeLuxembourgerMacedonianMalaysianMalteseMarshalleseMenomineeMexicanMexican American IndianMongolianMoroccanNative HawaiianNavajoNepaleseNew ZealanderNicaraguanNigerianNorthern EuropeanNorwegianOkinawanOsageOttawaPaiutePakistaniPalestinianPanamanianParaguayanPennsylvania GermanPeruvianPimaPolishPortuguesePotawatomiPuebloPuerto RicanPuget Sound SalishRomanianRussianSalvadoranSamoanScandinavianScotch-IrishScottishSeminoleSenegaleseSerbianShoshoneSierra LeoneanSiouxSlavicSlovakSloveneSomaliSouth AfricanSouth AmericanSouth American IndianSoviet UnionSpaniardSpanishSpanish AmericanSpanish American IndianSri LankanSubsaharan AfricanSudaneseSwedishSwissSyrianTaiwaneseThaiTlingit-HaidaTohono O'OdhamTonganTrinidadian and TobagonianTsimshianTurkishU.S. Virgin IslanderUgandanUkrainianUruguayanUteVenezuelanVietnameseWelshWest IndianYakamaYaquiYugoslavianYumanYup'ikZimbabwean
Immigration
NonimmigrantsImmigrantsAfghanistanAfricaAlbaniaArgentinaArmeniaAsiaAustraliaAustriaBahamasBangladeshBarbadosBelarusBelgiumBelizeBoliviaBosnia and HerzegovinaBrazilBulgariaBurma/MyanmarCabo VerdeCambodiaCameroonCanadaCaribbeanCentral AmericaChileChinaColombiaCongoCosta RicaCroatiaCubaCzechoslovakiaDenmarkDominicaDominican RepublicEastern AfricaEastern AsiaEastern EuropeEcuadorEgyptEl SalvadorEnglandEritreaEthiopiaEuropeFijiFranceGermanyGhanaGreeceGrenadaGuatemalaGuyanaHaitiHondurasHong KongHungaryIndiaIndonesiaIranIraqIrelandIsraelItalyJamaicaJapanJordanKazakhstanKenyaKoreaKuwaitLaosLatin AmericaLatviaLebanonLiberiaLithuaniaMalaysiaMexicoMicronesiaMiddle AfricaMoldovaMoroccoNepalNetherlandsNicaraguaNigeriaNorth AmericaNorth MacedoniaNorthern AfricaNorthern EuropeNorwayOceaniaPakistanPanamaPeruPhilippinesPolandPortugalRomaniaRussiaSaudi ArabiaScotlandSenegalSerbiaSierra LeoneSingaporeSomaliaSouth AfricaSouth AmericaSouth Central AsiaSouth Eastern AsiaSouthern EuropeSpainSri LankaSt. Vincent and the GrenadinesSudanSwedenSwitzerlandSyriaTaiwanThailandTrinidad and TobagoTurkeyUgandaUkraineUruguayUzbekistanVenezuelaVietnamWest IndiesWestern AfricaWestern AsiaWestern EuropeYemenZaireZimbabweAzores
Arapaho
Race
Ancestry
AfghanAfricanAlaska NativeAlaskan AthabascanAlbanianAleutAlsatianAmericanApacheArabArapahoArgentineanArmenianAssyrian/Chaldean/SyriacAustralianAustrianBahamianBangladeshiBarbadianBasqueBelgianBelizeanBermudanBhutaneseBlackfeetBolivianBrazilianBritishBritish West IndianBulgarianBurmeseCajunCambodianCanadianCape VerdeanCarpatho RusynCelticCentral AmericanCentral American IndianCherokeeCheyenneChickasawChileanChineseChippewaChoctawColombianColvilleComancheCosta RicanCreeCreekCroatianCrowCubanCypriotCzechCzechoslovakianDanishDelawareDominicanDutchDutch West IndianEastern EuropeanEcuadorianEgyptianEnglishEstonianEthiopianEuropeanFijianFilipinoFinnishFrenchFrench American IndianFrench CanadianGermanGerman RussianGhanaianGreekGuamanian/ChamorroGuatemalanGuyaneseHaitianHmongHonduranHopiHoumaHungarianIcelanderIndian (Asian)IndonesianInupiatIranianIraqiIroquoisIsraeliItalianJamaicanJapaneseJordanianKenyanKiowaKoreanLaotianLatvianLebaneseLiberianLithuanianLumbeeLuxembourgerMacedonianMalaysianMalteseMarshalleseMenomineeMexicanMexican American IndianMongolianMoroccanNative HawaiianNavajoNepaleseNew ZealanderNicaraguanNigerianNorthern EuropeanNorwegianOkinawanOsageOttawaPaiutePakistaniPalestinianPanamanianParaguayanPennsylvania GermanPeruvianPimaPolishPortuguesePotawatomiPuebloPuerto RicanPuget Sound SalishRomanianRussianSalvadoranSamoanScandinavianScotch-IrishScottishSeminoleSenegaleseSerbianShoshoneSierra LeoneanSiouxSlavicSlovakSloveneSomaliSouth AfricanSouth AmericanSouth American IndianSoviet UnionSpaniardSpanishSpanish AmericanSpanish American IndianSri LankanSubsaharan AfricanSudaneseSwedishSwissSyrianTaiwaneseThaiTlingit-HaidaTohono O'OdhamTonganTrinidadian and TobagonianTsimshianTurkishU.S. Virgin IslanderUgandanUkrainianUruguayanUteVenezuelanVietnameseWelshWest IndianYakamaYaquiYugoslavianYumanYup'ikZimbabwean
Immigration
NonimmigrantsImmigrantsAfghanistanAfricaAlbaniaArgentinaArmeniaAsiaAustraliaAustriaBahamasBangladeshBarbadosBelarusBelgiumBelizeBoliviaBosnia and HerzegovinaBrazilBulgariaBurma/MyanmarCabo VerdeCambodiaCameroonCanadaCaribbeanCentral AmericaChileChinaColombiaCongoCosta RicaCroatiaCubaCzechoslovakiaDenmarkDominicaDominican RepublicEastern AfricaEastern AsiaEastern EuropeEcuadorEgyptEl SalvadorEnglandEritreaEthiopiaEuropeFijiFranceGermanyGhanaGreeceGrenadaGuatemalaGuyanaHaitiHondurasHong KongHungaryIndiaIndonesiaIranIraqIrelandIsraelItalyJamaicaJapanJordanKazakhstanKenyaKoreaKuwaitLaosLatin AmericaLatviaLebanonLiberiaLithuaniaMalaysiaMexicoMicronesiaMiddle AfricaMoldovaMoroccoNepalNetherlandsNicaraguaNigeriaNorth AmericaNorth MacedoniaNorthern AfricaNorthern EuropeNorwayOceaniaPakistanPanamaPeruPhilippinesPolandPortugalRomaniaRussiaSaudi ArabiaScotlandSenegalSerbiaSierra LeoneSingaporeSomaliaSouth AfricaSouth AmericaSouth Central AsiaSouth Eastern AsiaSouthern EuropeSpainSri LankaSt. Vincent and the GrenadinesSudanSwedenSwitzerlandSyriaTaiwanThailandTrinidad and TobagoTurkeyUgandaUkraineUruguayUzbekistanVenezuelaVietnamWest IndiesWestern AfricaWestern AsiaWestern EuropeYemenZaireZimbabweAzores
Child Poverty Among Boys Under 16
Income
Poverty
Unemployment
Labor Participation
Family Structure
Vehicle Availability
Education Level
Disability

Child Poverty Among Boys Under 16 Comparison

Irish

Arapaho

Exceptional
Tragic
15.2%
CHILD POVERTY AMONG BOYS UNDER 16
93.8/ 100
METRIC RATING
113th/ 347
METRIC RANK
20.2%
CHILD POVERTY AMONG BOYS UNDER 16
0.0/ 100
METRIC RATING
285th/ 347
METRIC RANK

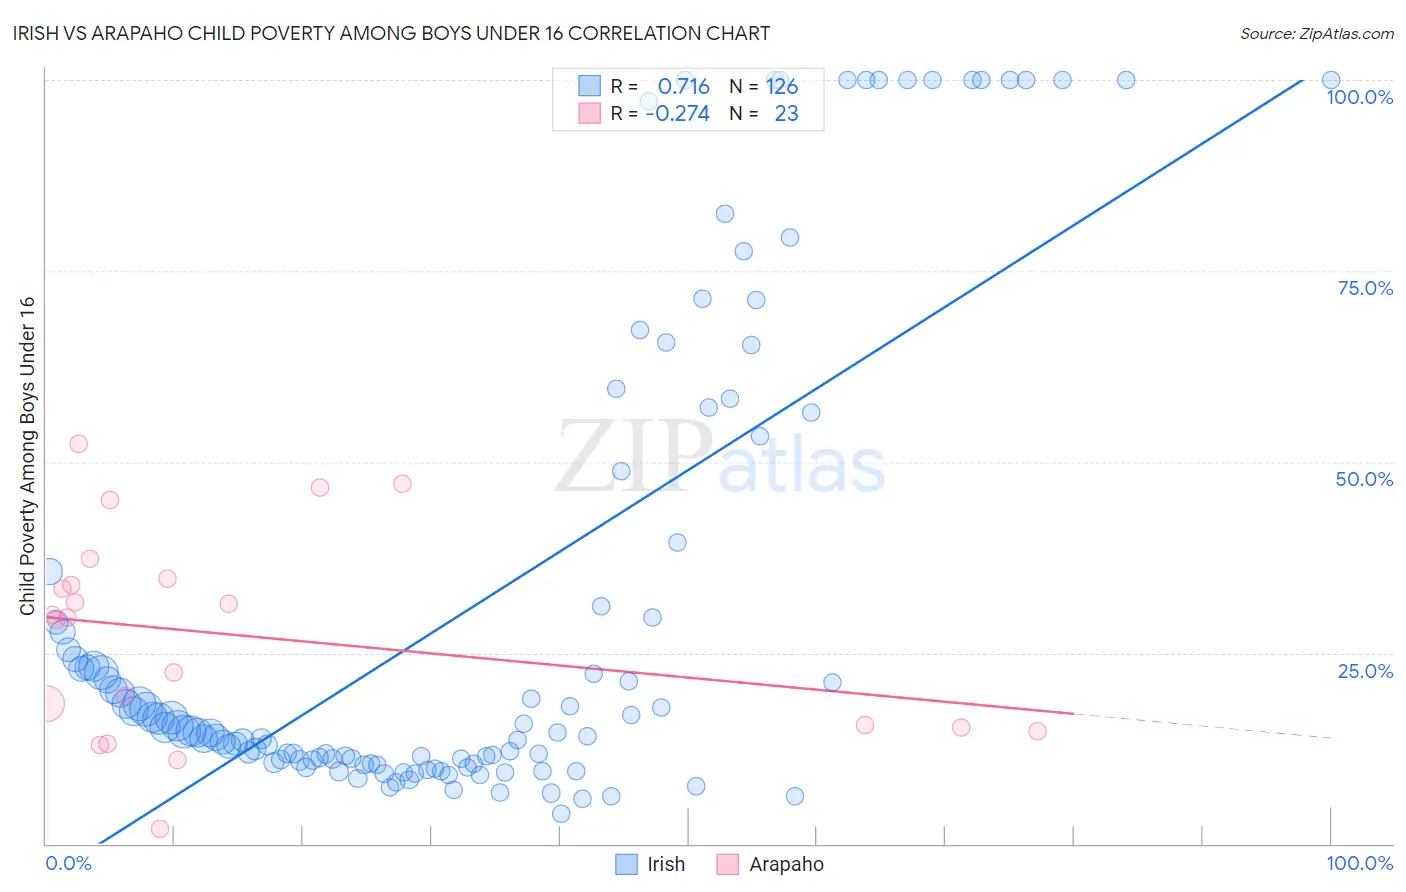
Irish vs Arapaho Child Poverty Among Boys Under 16 Correlation Chart

The statistical analysis conducted on geographies consisting of 557,205,083 people shows a strong positive correlation between the proportion of Irish and poverty level among boys under the age of 16 in the United States with a correlation coefficient (R) of 0.716 and weighted average of 15.2%. Similarly, the statistical analysis conducted on geographies consisting of 29,694,032 people shows a weak negative correlation between the proportion of Arapaho and poverty level among boys under the age of 16 in the United States with a correlation coefficient (R) of -0.274 and weighted average of 20.2%, a difference of 32.9%.
Irish vs Arapaho Child Poverty Among Boys Under 16

Child Poverty Among Boys Under 16 Correlation Summary

MeasurementIrishArapaho
Minimum3.8%1.9%
Maximum100.0%52.3%
Range96.2%50.4%
Mean30.9%27.3%
Median14.7%29.6%
Interquartile 25% (IQ1)10.9%15.3%
Interquartile 75% (IQ3)35.6%34.8%
Interquartile Range (IQR)24.7%19.5%
Standard Deviation (Sample)31.5%13.4%
Standard Deviation (Population)31.4%13.1%

Similar Demographics by Child Poverty Among Boys Under 16

Demographics Similar to Irish by Child Poverty Among Boys Under 16

In terms of child poverty among boys under 16, the demographic groups most similar to Irish are Basque (15.2%, a difference of 0.040%), Immigrants from Ukraine (15.2%, a difference of 0.050%), Armenian (15.2%, a difference of 0.070%), Immigrants from South Eastern Asia (15.2%, a difference of 0.11%), and Immigrants from Vietnam (15.2%, a difference of 0.13%).
DemographicsRating | RankChild Poverty Among Boys Under 16
Serbians
95.2
/100
|
#106
Exceptional
15.1%
Jordanians
95.1
/100
|
#107
Exceptional
15.1%
Immigrants | England
94.8
/100
|
#108
Exceptional
15.1%
Pakistanis
94.7
/100
|
#109
Exceptional
15.1%
English
94.3
/100
|
#110
Exceptional
15.1%
Immigrants | Zimbabwe
94.2
/100
|
#111
Exceptional
15.2%
Basques
93.8
/100
|
#112
Exceptional
15.2%
Irish
93.8
/100
|
#113
Exceptional
15.2%
Immigrants | Ukraine
93.6
/100
|
#114
Exceptional
15.2%
Armenians
93.6
/100
|
#115
Exceptional
15.2%
Immigrants | South Eastern Asia
93.5
/100
|
#116
Exceptional
15.2%
Immigrants | Vietnam
93.5
/100
|
#117
Exceptional
15.2%
Native Hawaiians
93.4
/100
|
#118
Exceptional
15.2%
Belgians
93.1
/100
|
#119
Exceptional
15.2%
South Africans
93.0
/100
|
#120
Exceptional
15.2%

Demographics Similar to Arapaho by Child Poverty Among Boys Under 16

In terms of child poverty among boys under 16, the demographic groups most similar to Arapaho are Barbadian (20.2%, a difference of 0.15%), West Indian (20.3%, a difference of 0.34%), Immigrants from Jamaica (20.1%, a difference of 0.38%), Immigrants from Belize (20.3%, a difference of 0.40%), and Comanche (20.1%, a difference of 0.50%).
DemographicsRating | RankChild Poverty Among Boys Under 16
Immigrants | West Indies
0.0
/100
|
#278
Tragic
20.0%
Bangladeshis
0.0
/100
|
#279
Tragic
20.0%
Central Americans
0.0
/100
|
#280
Tragic
20.1%
Immigrants | Zaire
0.0
/100
|
#281
Tragic
20.1%
Comanche
0.0
/100
|
#282
Tragic
20.1%
Immigrants | Jamaica
0.0
/100
|
#283
Tragic
20.1%
Barbadians
0.0
/100
|
#284
Tragic
20.2%
Arapaho
0.0
/100
|
#285
Tragic
20.2%
West Indians
0.0
/100
|
#286
Tragic
20.3%
Immigrants | Belize
0.0
/100
|
#287
Tragic
20.3%
Immigrants | St. Vincent and the Grenadines
0.0
/100
|
#288
Tragic
20.3%
Blackfeet
0.0
/100
|
#289
Tragic
20.4%
Senegalese
0.0
/100
|
#290
Tragic
20.6%
Immigrants | Latin America
0.0
/100
|
#291
Tragic
20.6%
Yaqui
0.0
/100
|
#292
Tragic
20.7%