Irish vs Immigrants from Egypt Child Poverty Among Boys Under 16
COMPARE
Irish
Immigrants from Egypt
Child Poverty Among Boys Under 16
Child Poverty Among Boys Under 16 Comparison
Irish
Immigrants from Egypt
15.2%
CHILD POVERTY AMONG BOYS UNDER 16
93.8/ 100
METRIC RATING
113th/ 347
METRIC RANK
14.9%
CHILD POVERTY AMONG BOYS UNDER 16
96.2/ 100
METRIC RATING
97th/ 347
METRIC RANK
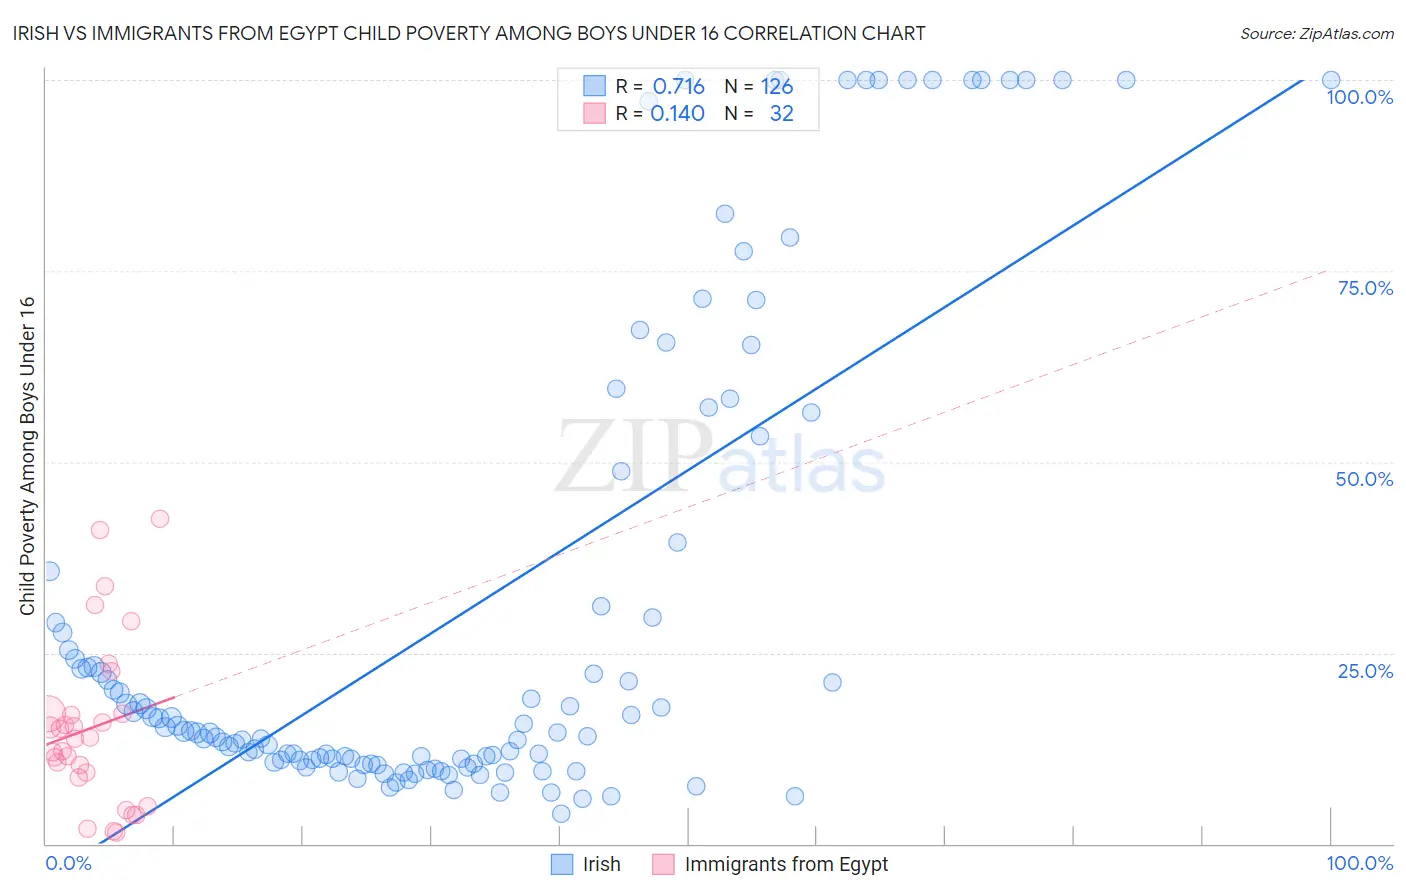
Irish vs Immigrants from Egypt Child Poverty Among Boys Under 16 Correlation Chart
The statistical analysis conducted on geographies consisting of 557,205,083 people shows a strong positive correlation between the proportion of Irish and poverty level among boys under the age of 16 in the United States with a correlation coefficient (R) of 0.716 and weighted average of 15.2%. Similarly, the statistical analysis conducted on geographies consisting of 242,739,180 people shows a poor positive correlation between the proportion of Immigrants from Egypt and poverty level among boys under the age of 16 in the United States with a correlation coefficient (R) of 0.140 and weighted average of 14.9%, a difference of 1.6%.
Child Poverty Among Boys Under 16 Correlation Summary
| Measurement | Irish | Immigrants from Egypt |
| Minimum | 3.8% | 1.4% |
| Maximum | 100.0% | 42.5% |
| Range | 96.2% | 41.1% |
| Mean | 30.9% | 15.2% |
| Median | 14.7% | 13.8% |
| Interquartile 25% (IQ1) | 10.9% | 9.0% |
| Interquartile 75% (IQ3) | 35.6% | 17.0% |
| Interquartile Range (IQR) | 24.7% | 8.0% |
| Standard Deviation (Sample) | 31.5% | 10.7% |
| Standard Deviation (Population) | 31.4% | 10.5% |
Demographics Similar to Irish and Immigrants from Egypt by Child Poverty Among Boys Under 16
In terms of child poverty among boys under 16, the demographic groups most similar to Irish are Basque (15.2%, a difference of 0.040%), Immigrants from Ukraine (15.2%, a difference of 0.050%), Armenian (15.2%, a difference of 0.070%), Immigrants from Zimbabwe (15.2%, a difference of 0.24%), and English (15.1%, a difference of 0.29%). Similarly, the demographic groups most similar to Immigrants from Egypt are Immigrants from North Macedonia (14.9%, a difference of 0.010%), British (15.0%, a difference of 0.040%), Immigrants from France (15.0%, a difference of 0.14%), Finnish (14.9%, a difference of 0.26%), and Chilean (15.0%, a difference of 0.37%).
| Demographics | Rating | Rank | Child Poverty Among Boys Under 16 |
| Finns | 96.5 /100 | #95 | Exceptional 14.9% |
| Immigrants | North Macedonia | 96.3 /100 | #96 | Exceptional 14.9% |
| Immigrants | Egypt | 96.2 /100 | #97 | Exceptional 14.9% |
| British | 96.2 /100 | #98 | Exceptional 15.0% |
| Immigrants | France | 96.1 /100 | #99 | Exceptional 15.0% |
| Chileans | 95.8 /100 | #100 | Exceptional 15.0% |
| Immigrants | Belarus | 95.7 /100 | #101 | Exceptional 15.0% |
| Romanians | 95.6 /100 | #102 | Exceptional 15.0% |
| Immigrants | Denmark | 95.6 /100 | #103 | Exceptional 15.0% |
| Immigrants | Switzerland | 95.4 /100 | #104 | Exceptional 15.0% |
| Dutch | 95.4 /100 | #105 | Exceptional 15.0% |
| Serbians | 95.2 /100 | #106 | Exceptional 15.1% |
| Jordanians | 95.1 /100 | #107 | Exceptional 15.1% |
| Immigrants | England | 94.8 /100 | #108 | Exceptional 15.1% |
| Pakistanis | 94.7 /100 | #109 | Exceptional 15.1% |
| English | 94.3 /100 | #110 | Exceptional 15.1% |
| Immigrants | Zimbabwe | 94.2 /100 | #111 | Exceptional 15.2% |
| Basques | 93.8 /100 | #112 | Exceptional 15.2% |
| Irish | 93.8 /100 | #113 | Exceptional 15.2% |
| Immigrants | Ukraine | 93.6 /100 | #114 | Exceptional 15.2% |
| Armenians | 93.6 /100 | #115 | Exceptional 15.2% |