Immigrants from El Salvador vs Arapaho Child Poverty Among Boys Under 16
COMPARE
Immigrants from El Salvador
Arapaho
Child Poverty Among Boys Under 16
Child Poverty Among Boys Under 16 Comparison
Immigrants from El Salvador
Arapaho
19.6%
CHILD POVERTY AMONG BOYS UNDER 16
0.1/ 100
METRIC RATING
266th/ 347
METRIC RANK
20.2%
CHILD POVERTY AMONG BOYS UNDER 16
0.0/ 100
METRIC RATING
285th/ 347
METRIC RANK
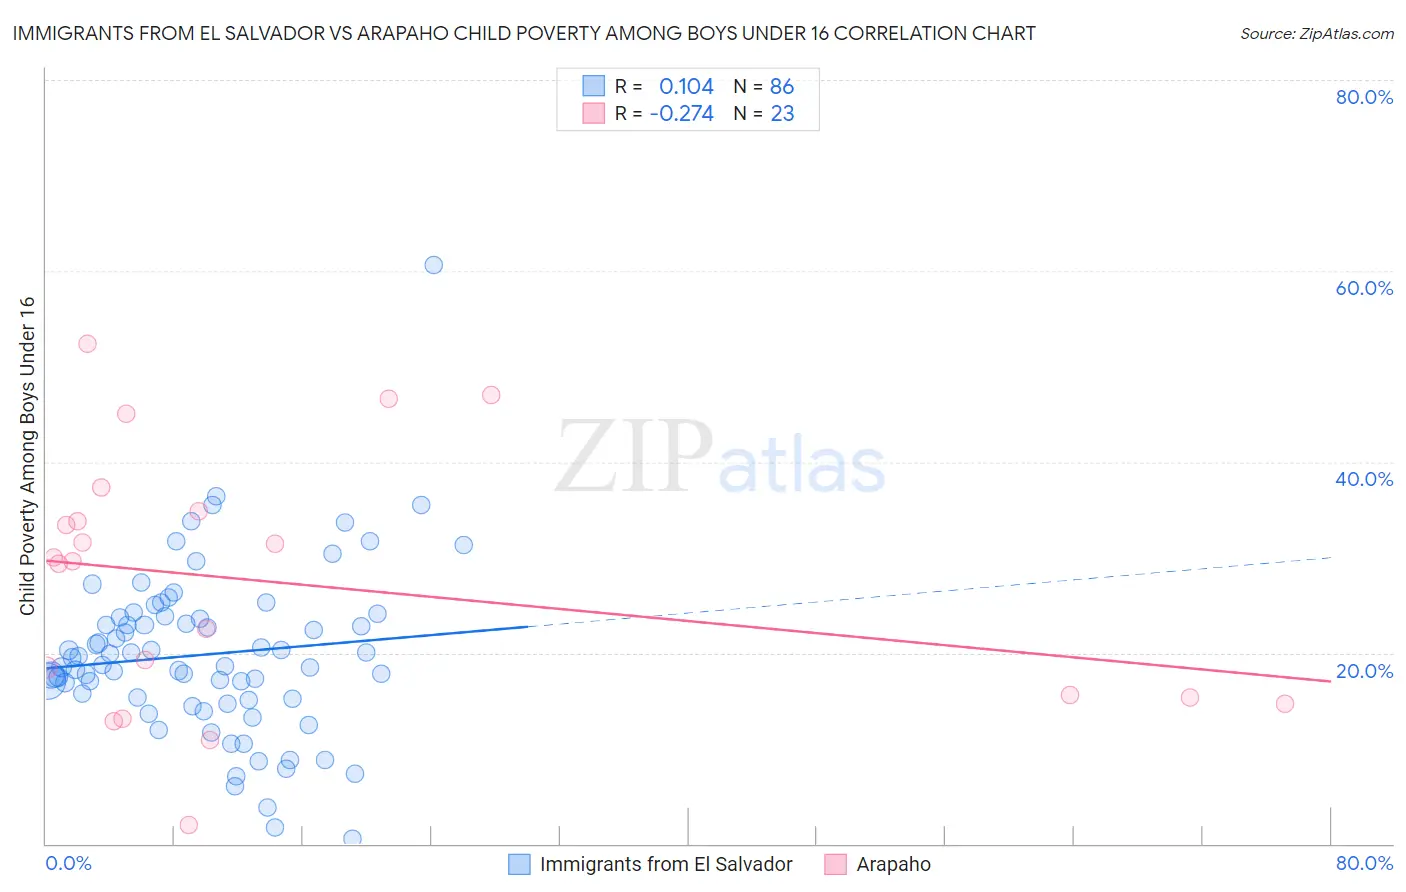
Immigrants from El Salvador vs Arapaho Child Poverty Among Boys Under 16 Correlation Chart
The statistical analysis conducted on geographies consisting of 354,572,517 people shows a poor positive correlation between the proportion of Immigrants from El Salvador and poverty level among boys under the age of 16 in the United States with a correlation coefficient (R) of 0.104 and weighted average of 19.6%. Similarly, the statistical analysis conducted on geographies consisting of 29,694,032 people shows a weak negative correlation between the proportion of Arapaho and poverty level among boys under the age of 16 in the United States with a correlation coefficient (R) of -0.274 and weighted average of 20.2%, a difference of 3.0%.
Child Poverty Among Boys Under 16 Correlation Summary
| Measurement | Immigrants from El Salvador | Arapaho |
| Minimum | 0.59% | 1.9% |
| Maximum | 60.6% | 52.3% |
| Range | 60.0% | 50.4% |
| Mean | 19.8% | 27.3% |
| Median | 19.1% | 29.6% |
| Interquartile 25% (IQ1) | 15.2% | 15.3% |
| Interquartile 75% (IQ3) | 23.7% | 34.8% |
| Interquartile Range (IQR) | 8.4% | 19.5% |
| Standard Deviation (Sample) | 8.8% | 13.4% |
| Standard Deviation (Population) | 8.7% | 13.1% |
Demographics Similar to Immigrants from El Salvador and Arapaho by Child Poverty Among Boys Under 16
In terms of child poverty among boys under 16, the demographic groups most similar to Immigrants from El Salvador are Vietnamese (19.6%, a difference of 0.010%), Guyanese (19.6%, a difference of 0.040%), Spanish American Indian (19.6%, a difference of 0.12%), Immigrants from Cabo Verde (19.7%, a difference of 0.29%), and Cherokee (19.7%, a difference of 0.57%). Similarly, the demographic groups most similar to Arapaho are Barbadian (20.2%, a difference of 0.15%), Immigrants from Jamaica (20.1%, a difference of 0.38%), Comanche (20.1%, a difference of 0.50%), Immigrants from Zaire (20.1%, a difference of 0.56%), and Central American (20.1%, a difference of 0.62%).
| Demographics | Rating | Rank | Child Poverty Among Boys Under 16 |
| Guyanese | 0.1 /100 | #265 | Tragic 19.6% |
| Immigrants | El Salvador | 0.1 /100 | #266 | Tragic 19.6% |
| Vietnamese | 0.1 /100 | #267 | Tragic 19.6% |
| Spanish American Indians | 0.1 /100 | #268 | Tragic 19.6% |
| Immigrants | Cabo Verde | 0.1 /100 | #269 | Tragic 19.7% |
| Cherokee | 0.1 /100 | #270 | Tragic 19.7% |
| Chickasaw | 0.1 /100 | #271 | Tragic 19.8% |
| Immigrants | Ecuador | 0.1 /100 | #272 | Tragic 19.8% |
| Belizeans | 0.1 /100 | #273 | Tragic 19.9% |
| Immigrants | Bangladesh | 0.0 /100 | #274 | Tragic 19.9% |
| Jamaicans | 0.0 /100 | #275 | Tragic 20.0% |
| Sub-Saharan Africans | 0.0 /100 | #276 | Tragic 20.0% |
| Immigrants | Barbados | 0.0 /100 | #277 | Tragic 20.0% |
| Immigrants | West Indies | 0.0 /100 | #278 | Tragic 20.0% |
| Bangladeshis | 0.0 /100 | #279 | Tragic 20.0% |
| Central Americans | 0.0 /100 | #280 | Tragic 20.1% |
| Immigrants | Zaire | 0.0 /100 | #281 | Tragic 20.1% |
| Comanche | 0.0 /100 | #282 | Tragic 20.1% |
| Immigrants | Jamaica | 0.0 /100 | #283 | Tragic 20.1% |
| Barbadians | 0.0 /100 | #284 | Tragic 20.2% |
| Arapaho | 0.0 /100 | #285 | Tragic 20.2% |