Iraqi vs Immigrants from Norway Unemployment Among Women with Children Under 18 years
COMPARE
Iraqi
Immigrants from Norway
Unemployment Among Women with Children Under 18 years
Unemployment Among Women with Children Under 18 years Comparison
Iraqis
Immigrants from Norway
5.5%
UNEMPLOYMENT AMONG WOMEN WITH CHILDREN UNDER 18 YEARS
35.3/ 100
METRIC RATING
188th/ 347
METRIC RANK
5.3%
UNEMPLOYMENT AMONG WOMEN WITH CHILDREN UNDER 18 YEARS
76.2/ 100
METRIC RATING
140th/ 347
METRIC RANK
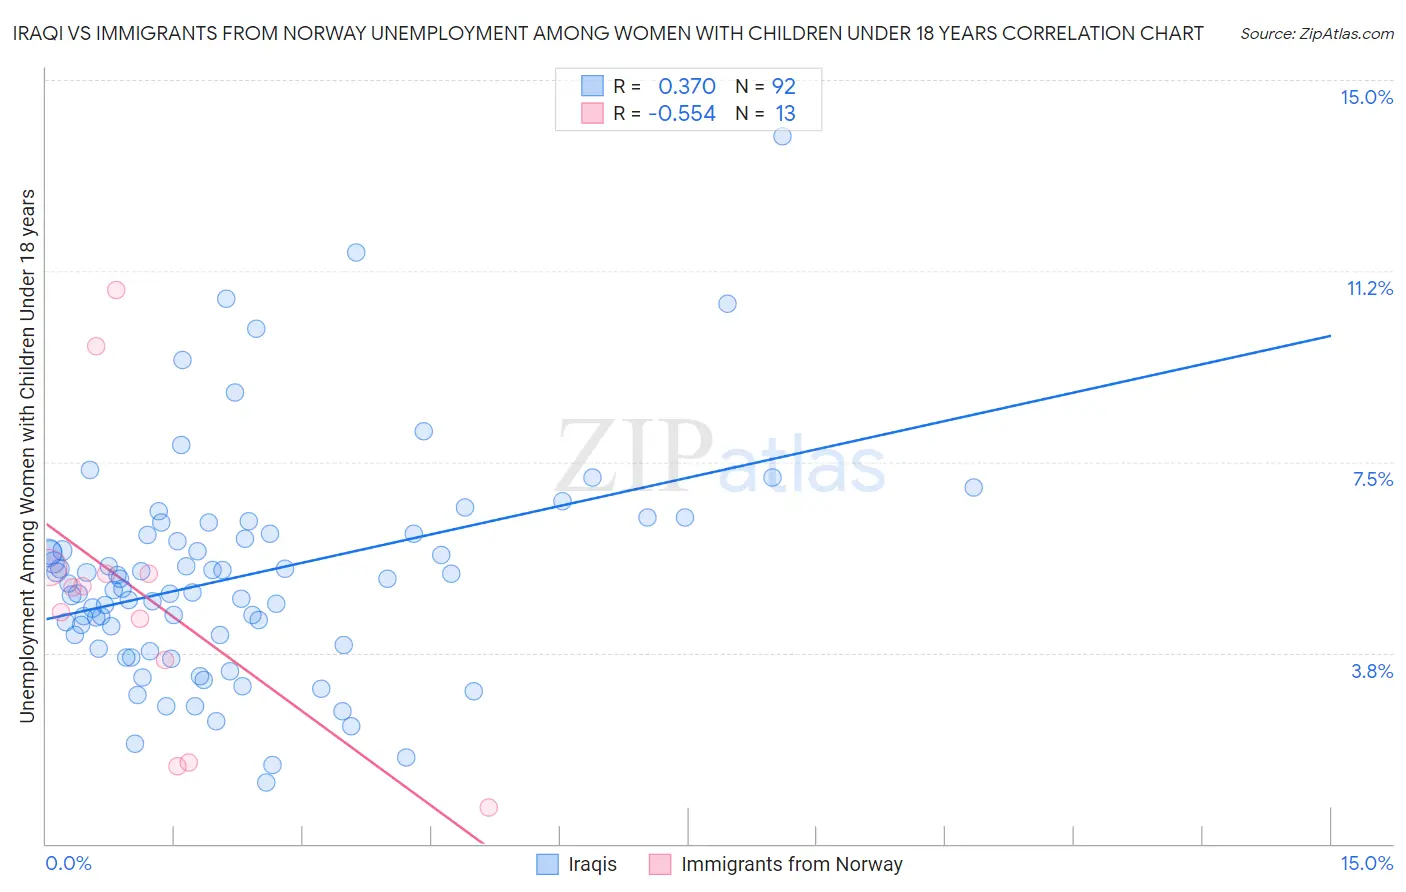
Iraqi vs Immigrants from Norway Unemployment Among Women with Children Under 18 years Correlation Chart
The statistical analysis conducted on geographies consisting of 168,205,992 people shows a mild positive correlation between the proportion of Iraqis and unemployment rate among women with children under the age of 18 in the United States with a correlation coefficient (R) of 0.370 and weighted average of 5.5%. Similarly, the statistical analysis conducted on geographies consisting of 114,528,417 people shows a substantial negative correlation between the proportion of Immigrants from Norway and unemployment rate among women with children under the age of 18 in the United States with a correlation coefficient (R) of -0.554 and weighted average of 5.3%, a difference of 3.2%.
Unemployment Among Women with Children Under 18 years Correlation Summary
| Measurement | Iraqi | Immigrants from Norway |
| Minimum | 1.2% | 0.70% |
| Maximum | 13.9% | 10.9% |
| Range | 12.7% | 10.2% |
| Mean | 5.3% | 4.9% |
| Median | 5.1% | 5.0% |
| Interquartile 25% (IQ1) | 4.0% | 2.6% |
| Interquartile 75% (IQ3) | 6.1% | 5.4% |
| Interquartile Range (IQR) | 2.1% | 2.8% |
| Standard Deviation (Sample) | 2.2% | 2.9% |
| Standard Deviation (Population) | 2.1% | 2.8% |
Similar Demographics by Unemployment Among Women with Children Under 18 years
Demographics Similar to Iraqis by Unemployment Among Women with Children Under 18 years
In terms of unemployment among women with children under 18 years, the demographic groups most similar to Iraqis are Malaysian (5.5%, a difference of 0.030%), Indonesian (5.5%, a difference of 0.080%), Immigrants from Eritrea (5.5%, a difference of 0.12%), Immigrants from Zaire (5.5%, a difference of 0.21%), and Immigrants from Cambodia (5.5%, a difference of 0.23%).
| Demographics | Rating | Rank | Unemployment Among Women with Children Under 18 years |
| Immigrants | Hungary | 41.3 /100 | #181 | Average 5.5% |
| Immigrants | Sudan | 40.6 /100 | #182 | Average 5.5% |
| Immigrants | Laos | 38.8 /100 | #183 | Fair 5.5% |
| Immigrants | Cambodia | 38.4 /100 | #184 | Fair 5.5% |
| Immigrants | Zaire | 38.1 /100 | #185 | Fair 5.5% |
| Indonesians | 36.3 /100 | #186 | Fair 5.5% |
| Malaysians | 35.7 /100 | #187 | Fair 5.5% |
| Iraqis | 35.3 /100 | #188 | Fair 5.5% |
| Immigrants | Eritrea | 33.8 /100 | #189 | Fair 5.5% |
| Immigrants | Poland | 31.2 /100 | #190 | Fair 5.5% |
| South American Indians | 30.8 /100 | #191 | Fair 5.5% |
| Immigrants | Spain | 30.7 /100 | #192 | Fair 5.5% |
| Immigrants | Afghanistan | 29.3 /100 | #193 | Fair 5.5% |
| Immigrants | Chile | 29.2 /100 | #194 | Fair 5.5% |
| Colombians | 22.8 /100 | #195 | Fair 5.6% |
Demographics Similar to Immigrants from Norway by Unemployment Among Women with Children Under 18 years
In terms of unemployment among women with children under 18 years, the demographic groups most similar to Immigrants from Norway are Venezuelan (5.3%, a difference of 0.020%), Immigrants from Venezuela (5.3%, a difference of 0.080%), Chilean (5.3%, a difference of 0.12%), Immigrants from England (5.3%, a difference of 0.13%), and Immigrants from Egypt (5.3%, a difference of 0.21%).
| Demographics | Rating | Rank | Unemployment Among Women with Children Under 18 years |
| Ethiopians | 80.7 /100 | #133 | Excellent 5.3% |
| Slovaks | 80.5 /100 | #134 | Excellent 5.3% |
| New Zealanders | 79.9 /100 | #135 | Good 5.3% |
| Immigrants | Jordan | 79.5 /100 | #136 | Good 5.3% |
| Jordanians | 78.8 /100 | #137 | Good 5.3% |
| Argentineans | 78.8 /100 | #138 | Good 5.3% |
| Immigrants | Ukraine | 78.5 /100 | #139 | Good 5.3% |
| Immigrants | Norway | 76.2 /100 | #140 | Good 5.3% |
| Venezuelans | 76.0 /100 | #141 | Good 5.3% |
| Immigrants | Venezuela | 75.4 /100 | #142 | Good 5.3% |
| Chileans | 75.0 /100 | #143 | Good 5.3% |
| Immigrants | England | 74.9 /100 | #144 | Good 5.3% |
| Immigrants | Egypt | 74.0 /100 | #145 | Good 5.3% |
| Immigrants | Belarus | 73.4 /100 | #146 | Good 5.3% |
| Bangladeshis | 73.2 /100 | #147 | Good 5.3% |