Swedish vs Immigrants from Caribbean Family Poverty
COMPARE
Swedish
Immigrants from Caribbean
Family Poverty
Family Poverty Comparison
Swedes
Immigrants from Caribbean
7.1%
FAMILY POVERTY
99.8/ 100
METRIC RATING
13th/ 347
METRIC RANK
12.2%
FAMILY POVERTY
0.0/ 100
METRIC RATING
313th/ 347
METRIC RANK
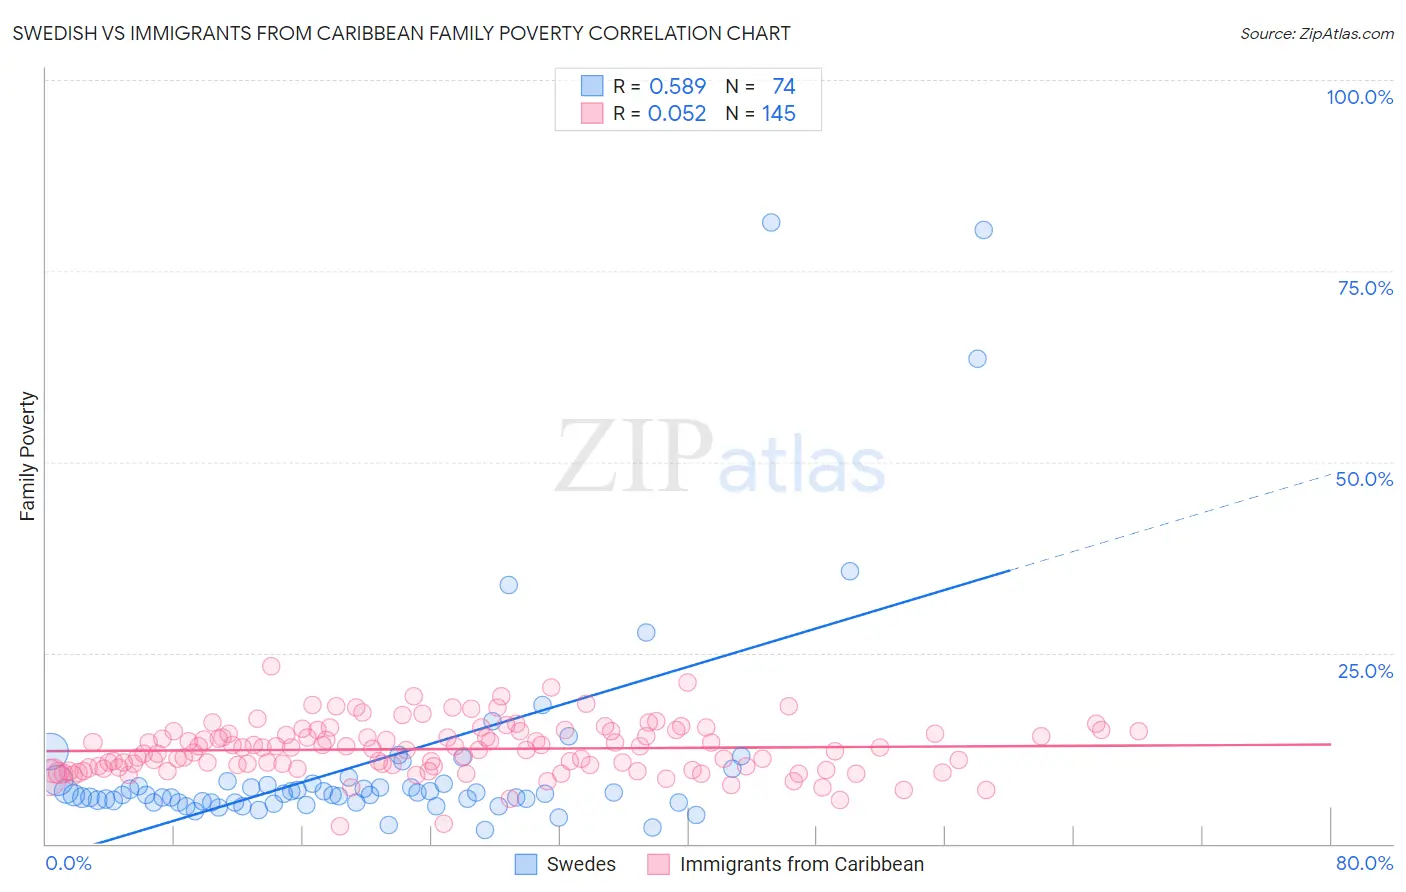
Swedish vs Immigrants from Caribbean Family Poverty Correlation Chart
The statistical analysis conducted on geographies consisting of 535,382,987 people shows a substantial positive correlation between the proportion of Swedes and poverty level among families in the United States with a correlation coefficient (R) of 0.589 and weighted average of 7.1%. Similarly, the statistical analysis conducted on geographies consisting of 448,312,225 people shows a slight positive correlation between the proportion of Immigrants from Caribbean and poverty level among families in the United States with a correlation coefficient (R) of 0.052 and weighted average of 12.2%, a difference of 71.1%.
Family Poverty Correlation Summary
| Measurement | Swedish | Immigrants from Caribbean |
| Minimum | 1.8% | 2.2% |
| Maximum | 81.3% | 23.2% |
| Range | 79.6% | 21.0% |
| Mean | 10.7% | 12.4% |
| Median | 6.5% | 12.5% |
| Interquartile 25% (IQ1) | 5.4% | 9.9% |
| Interquartile 75% (IQ3) | 7.9% | 14.7% |
| Interquartile Range (IQR) | 2.5% | 4.8% |
| Standard Deviation (Sample) | 14.6% | 3.4% |
| Standard Deviation (Population) | 14.5% | 3.4% |
Similar Demographics by Family Poverty
Demographics Similar to Swedes by Family Poverty
In terms of family poverty, the demographic groups most similar to Swedes are Iranian (7.1%, a difference of 0.010%), Maltese (7.1%, a difference of 0.050%), Immigrants from Singapore (7.1%, a difference of 0.34%), Bulgarian (7.1%, a difference of 0.35%), and Latvian (7.1%, a difference of 0.60%).
| Demographics | Rating | Rank | Family Poverty |
| Norwegians | 99.9 /100 | #6 | Exceptional 6.9% |
| Immigrants | Ireland | 99.9 /100 | #7 | Exceptional 7.0% |
| Bhutanese | 99.9 /100 | #8 | Exceptional 7.0% |
| Latvians | 99.9 /100 | #9 | Exceptional 7.1% |
| Bulgarians | 99.8 /100 | #10 | Exceptional 7.1% |
| Immigrants | Singapore | 99.8 /100 | #11 | Exceptional 7.1% |
| Maltese | 99.8 /100 | #12 | Exceptional 7.1% |
| Swedes | 99.8 /100 | #13 | Exceptional 7.1% |
| Iranians | 99.8 /100 | #14 | Exceptional 7.1% |
| Lithuanians | 99.8 /100 | #15 | Exceptional 7.2% |
| Immigrants | South Central Asia | 99.8 /100 | #16 | Exceptional 7.2% |
| Luxembourgers | 99.8 /100 | #17 | Exceptional 7.2% |
| Immigrants | Lithuania | 99.8 /100 | #18 | Exceptional 7.2% |
| Eastern Europeans | 99.7 /100 | #19 | Exceptional 7.2% |
| Immigrants | Hong Kong | 99.7 /100 | #20 | Exceptional 7.3% |
Demographics Similar to Immigrants from Caribbean by Family Poverty
In terms of family poverty, the demographic groups most similar to Immigrants from Caribbean are Kiowa (12.2%, a difference of 0.50%), Immigrants from Central America (12.1%, a difference of 0.68%), Immigrants from Mexico (12.3%, a difference of 0.76%), Ute (12.1%, a difference of 1.1%), and Honduran (12.4%, a difference of 1.5%).
| Demographics | Rating | Rank | Family Poverty |
| Cajuns | 0.0 /100 | #306 | Tragic 11.9% |
| Immigrants | Congo | 0.0 /100 | #307 | Tragic 11.9% |
| Seminole | 0.0 /100 | #308 | Tragic 11.9% |
| Hispanics or Latinos | 0.0 /100 | #309 | Tragic 12.0% |
| Immigrants | Guatemala | 0.0 /100 | #310 | Tragic 12.0% |
| Ute | 0.0 /100 | #311 | Tragic 12.1% |
| Immigrants | Central America | 0.0 /100 | #312 | Tragic 12.1% |
| Immigrants | Caribbean | 0.0 /100 | #313 | Tragic 12.2% |
| Kiowa | 0.0 /100 | #314 | Tragic 12.2% |
| Immigrants | Mexico | 0.0 /100 | #315 | Tragic 12.3% |
| Hondurans | 0.0 /100 | #316 | Tragic 12.4% |
| Immigrants | Grenada | 0.0 /100 | #317 | Tragic 12.4% |
| U.S. Virgin Islanders | 0.0 /100 | #318 | Tragic 12.4% |
| British West Indians | 0.0 /100 | #319 | Tragic 12.4% |
| Inupiat | 0.0 /100 | #320 | Tragic 12.5% |