Iraqi vs Immigrants from Belize In Labor Force | Age 30-34
COMPARE
Iraqi
Immigrants from Belize
In Labor Force | Age 30-34
In Labor Force | Age 30-34 Comparison
Iraqis
Immigrants from Belize
83.8%
IN LABOR FORCE | AGE 30-34
0.3/ 100
METRIC RATING
257th/ 347
METRIC RANK
83.2%
IN LABOR FORCE | AGE 30-34
0.0/ 100
METRIC RATING
284th/ 347
METRIC RANK
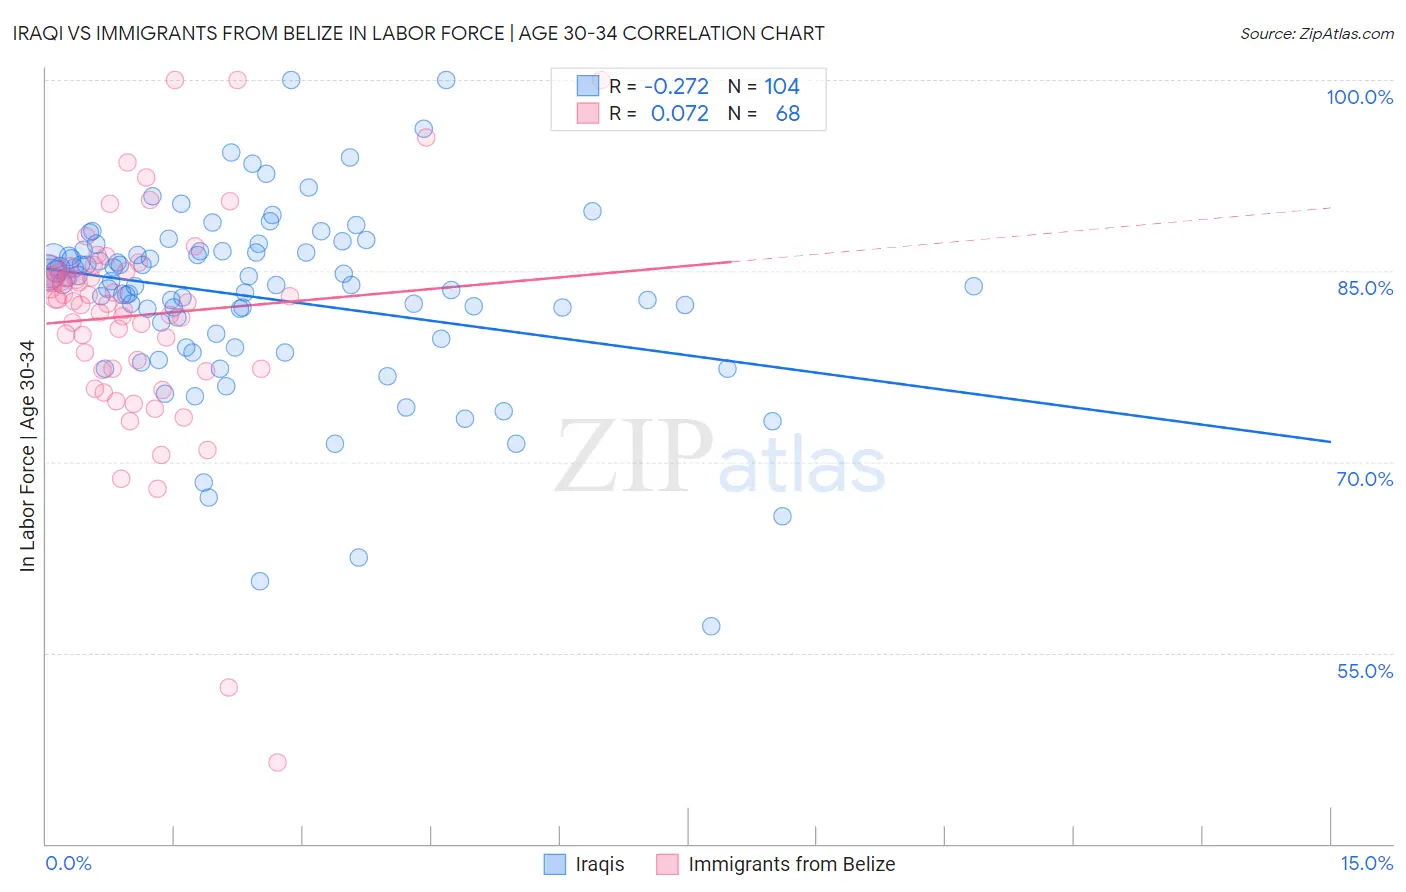
Iraqi vs Immigrants from Belize In Labor Force | Age 30-34 Correlation Chart
The statistical analysis conducted on geographies consisting of 170,642,929 people shows a weak negative correlation between the proportion of Iraqis and labor force participation rate among population between the ages 30 and 34 in the United States with a correlation coefficient (R) of -0.272 and weighted average of 83.8%. Similarly, the statistical analysis conducted on geographies consisting of 130,310,300 people shows a slight positive correlation between the proportion of Immigrants from Belize and labor force participation rate among population between the ages 30 and 34 in the United States with a correlation coefficient (R) of 0.072 and weighted average of 83.2%, a difference of 0.80%.
In Labor Force | Age 30-34 Correlation Summary
| Measurement | Iraqi | Immigrants from Belize |
| Minimum | 57.1% | 46.4% |
| Maximum | 100.0% | 100.0% |
| Range | 42.9% | 53.6% |
| Mean | 82.9% | 81.5% |
| Median | 84.0% | 82.6% |
| Interquartile 25% (IQ1) | 79.8% | 77.3% |
| Interquartile 75% (IQ3) | 86.5% | 84.9% |
| Interquartile Range (IQR) | 6.7% | 7.6% |
| Standard Deviation (Sample) | 7.2% | 8.8% |
| Standard Deviation (Population) | 7.2% | 8.7% |
Similar Demographics by In Labor Force | Age 30-34
Demographics Similar to Iraqis by In Labor Force | Age 30-34
In terms of in labor force | age 30-34, the demographic groups most similar to Iraqis are Immigrants from Lebanon (83.9%, a difference of 0.010%), Honduran (83.8%, a difference of 0.030%), Scotch-Irish (83.8%, a difference of 0.030%), Immigrants from Dominican Republic (83.8%, a difference of 0.050%), and White/Caucasian (83.9%, a difference of 0.060%).
| Demographics | Rating | Rank | In Labor Force | Age 30-34 |
| Immigrants | Iraq | 0.7 /100 | #250 | Tragic 83.9% |
| Nicaraguans | 0.6 /100 | #251 | Tragic 83.9% |
| Bahamians | 0.6 /100 | #252 | Tragic 83.9% |
| Immigrants | Nicaragua | 0.6 /100 | #253 | Tragic 83.9% |
| Immigrants | St. Vincent and the Grenadines | 0.5 /100 | #254 | Tragic 83.9% |
| Whites/Caucasians | 0.5 /100 | #255 | Tragic 83.9% |
| Immigrants | Lebanon | 0.4 /100 | #256 | Tragic 83.9% |
| Iraqis | 0.3 /100 | #257 | Tragic 83.8% |
| Hondurans | 0.3 /100 | #258 | Tragic 83.8% |
| Scotch-Irish | 0.3 /100 | #259 | Tragic 83.8% |
| Immigrants | Dominican Republic | 0.3 /100 | #260 | Tragic 83.8% |
| Guyanese | 0.3 /100 | #261 | Tragic 83.8% |
| Dominicans | 0.2 /100 | #262 | Tragic 83.8% |
| Immigrants | Guyana | 0.2 /100 | #263 | Tragic 83.8% |
| Guatemalans | 0.2 /100 | #264 | Tragic 83.7% |
Demographics Similar to Immigrants from Belize by In Labor Force | Age 30-34
In terms of in labor force | age 30-34, the demographic groups most similar to Immigrants from Belize are Cree (83.2%, a difference of 0.0%), Assyrian/Chaldean/Syriac (83.2%, a difference of 0.050%), Immigrants from Latin America (83.1%, a difference of 0.060%), Mexican American Indian (83.2%, a difference of 0.070%), and Samoan (83.3%, a difference of 0.10%).
| Demographics | Rating | Rank | In Labor Force | Age 30-34 |
| Delaware | 0.0 /100 | #277 | Tragic 83.5% |
| Fijians | 0.0 /100 | #278 | Tragic 83.4% |
| Immigrants | Fiji | 0.0 /100 | #279 | Tragic 83.4% |
| Africans | 0.0 /100 | #280 | Tragic 83.4% |
| Samoans | 0.0 /100 | #281 | Tragic 83.3% |
| Mexican American Indians | 0.0 /100 | #282 | Tragic 83.2% |
| Assyrians/Chaldeans/Syriacs | 0.0 /100 | #283 | Tragic 83.2% |
| Immigrants | Belize | 0.0 /100 | #284 | Tragic 83.2% |
| Cree | 0.0 /100 | #285 | Tragic 83.2% |
| Immigrants | Latin America | 0.0 /100 | #286 | Tragic 83.1% |
| Native Hawaiians | 0.0 /100 | #287 | Tragic 83.0% |
| Central American Indians | 0.0 /100 | #288 | Tragic 83.0% |
| Hawaiians | 0.0 /100 | #289 | Tragic 83.0% |
| Blackfeet | 0.0 /100 | #290 | Tragic 82.8% |
| Potawatomi | 0.0 /100 | #291 | Tragic 82.8% |