Inupiat vs Immigrants from Panama Female Poverty Among 25-34 Year Olds
COMPARE
Inupiat
Immigrants from Panama
Female Poverty Among 25-34 Year Olds
Female Poverty Among 25-34 Year Olds Comparison
Inupiat
Immigrants from Panama
18.5%
FEMALE POVERTY AMONG 25-34 YEAR OLDS
0.0/ 100
METRIC RATING
325th/ 347
METRIC RANK
14.1%
FEMALE POVERTY AMONG 25-34 YEAR OLDS
11.6/ 100
METRIC RATING
208th/ 347
METRIC RANK
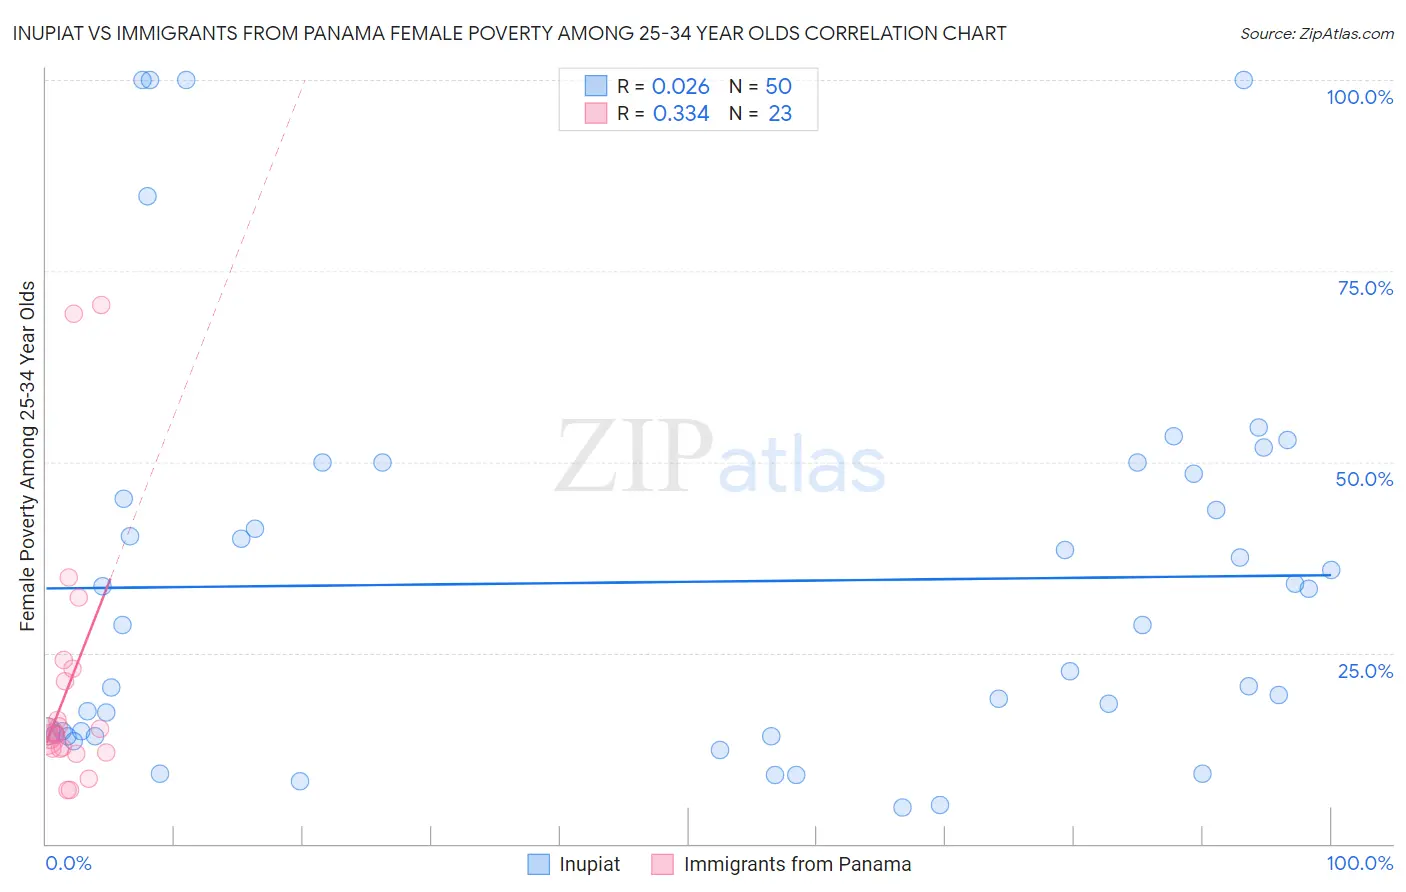
Inupiat vs Immigrants from Panama Female Poverty Among 25-34 Year Olds Correlation Chart
The statistical analysis conducted on geographies consisting of 95,902,522 people shows no correlation between the proportion of Inupiat and poverty level among females between the ages 25 and 34 in the United States with a correlation coefficient (R) of 0.026 and weighted average of 18.5%. Similarly, the statistical analysis conducted on geographies consisting of 219,926,572 people shows a mild positive correlation between the proportion of Immigrants from Panama and poverty level among females between the ages 25 and 34 in the United States with a correlation coefficient (R) of 0.334 and weighted average of 14.1%, a difference of 31.4%.
Female Poverty Among 25-34 Year Olds Correlation Summary
| Measurement | Inupiat | Immigrants from Panama |
| Minimum | 4.7% | 7.0% |
| Maximum | 100.0% | 70.5% |
| Range | 95.3% | 63.5% |
| Mean | 34.2% | 20.7% |
| Median | 28.6% | 14.3% |
| Interquartile 25% (IQ1) | 14.4% | 12.4% |
| Interquartile 75% (IQ3) | 48.5% | 22.9% |
| Interquartile Range (IQR) | 34.1% | 10.5% |
| Standard Deviation (Sample) | 26.0% | 17.0% |
| Standard Deviation (Population) | 25.7% | 16.7% |
Similar Demographics by Female Poverty Among 25-34 Year Olds
Demographics Similar to Inupiat by Female Poverty Among 25-34 Year Olds
In terms of female poverty among 25-34 year olds, the demographic groups most similar to Inupiat are Dutch West Indian (18.4%, a difference of 0.52%), Seminole (18.3%, a difference of 1.5%), Central American Indian (18.2%, a difference of 1.8%), Black/African American (18.9%, a difference of 2.0%), and Choctaw (18.1%, a difference of 2.6%).
| Demographics | Rating | Rank | Female Poverty Among 25-34 Year Olds |
| Ute | 0.0 /100 | #318 | Tragic 17.9% |
| Menominee | 0.0 /100 | #319 | Tragic 18.0% |
| Chippewa | 0.0 /100 | #320 | Tragic 18.0% |
| Choctaw | 0.0 /100 | #321 | Tragic 18.1% |
| Central American Indians | 0.0 /100 | #322 | Tragic 18.2% |
| Seminole | 0.0 /100 | #323 | Tragic 18.3% |
| Dutch West Indians | 0.0 /100 | #324 | Tragic 18.4% |
| Inupiat | 0.0 /100 | #325 | Tragic 18.5% |
| Blacks/African Americans | 0.0 /100 | #326 | Tragic 18.9% |
| Cheyenne | 0.0 /100 | #327 | Tragic 19.1% |
| Alaskan Athabascans | 0.0 /100 | #328 | Tragic 19.1% |
| Creek | 0.0 /100 | #329 | Tragic 19.2% |
| Paiute | 0.0 /100 | #330 | Tragic 19.6% |
| Kiowa | 0.0 /100 | #331 | Tragic 19.7% |
| Immigrants | Yemen | 0.0 /100 | #332 | Tragic 19.8% |
Demographics Similar to Immigrants from Panama by Female Poverty Among 25-34 Year Olds
In terms of female poverty among 25-34 year olds, the demographic groups most similar to Immigrants from Panama are Japanese (14.1%, a difference of 0.020%), Hungarian (14.1%, a difference of 0.040%), Immigrants from Africa (14.1%, a difference of 0.32%), Hawaiian (14.1%, a difference of 0.37%), and Immigrants (14.0%, a difference of 0.51%).
| Demographics | Rating | Rank | Female Poverty Among 25-34 Year Olds |
| Immigrants | Trinidad and Tobago | 17.6 /100 | #201 | Poor 14.0% |
| Welsh | 17.2 /100 | #202 | Poor 14.0% |
| Immigrants | Immigrants | 14.5 /100 | #203 | Poor 14.0% |
| Hawaiians | 13.6 /100 | #204 | Poor 14.1% |
| Immigrants | Africa | 13.4 /100 | #205 | Poor 14.1% |
| Hungarians | 11.8 /100 | #206 | Poor 14.1% |
| Japanese | 11.7 /100 | #207 | Poor 14.1% |
| Immigrants | Panama | 11.6 /100 | #208 | Poor 14.1% |
| Guyanese | 8.6 /100 | #209 | Tragic 14.2% |
| Panamanians | 8.6 /100 | #210 | Tragic 14.2% |
| Trinidadians and Tobagonians | 8.2 /100 | #211 | Tragic 14.2% |
| Immigrants | Guyana | 6.6 /100 | #212 | Tragic 14.3% |
| Puget Sound Salish | 6.5 /100 | #213 | Tragic 14.3% |
| French | 6.2 /100 | #214 | Tragic 14.3% |
| Immigrants | Nigeria | 6.2 /100 | #215 | Tragic 14.3% |