Cape Verdean vs Immigrants from Panama Female Poverty Among 25-34 Year Olds
COMPARE
Cape Verdean
Immigrants from Panama
Female Poverty Among 25-34 Year Olds
Female Poverty Among 25-34 Year Olds Comparison
Cape Verdeans
Immigrants from Panama
16.3%
FEMALE POVERTY AMONG 25-34 YEAR OLDS
0.0/ 100
METRIC RATING
286th/ 347
METRIC RANK
14.1%
FEMALE POVERTY AMONG 25-34 YEAR OLDS
11.6/ 100
METRIC RATING
208th/ 347
METRIC RANK
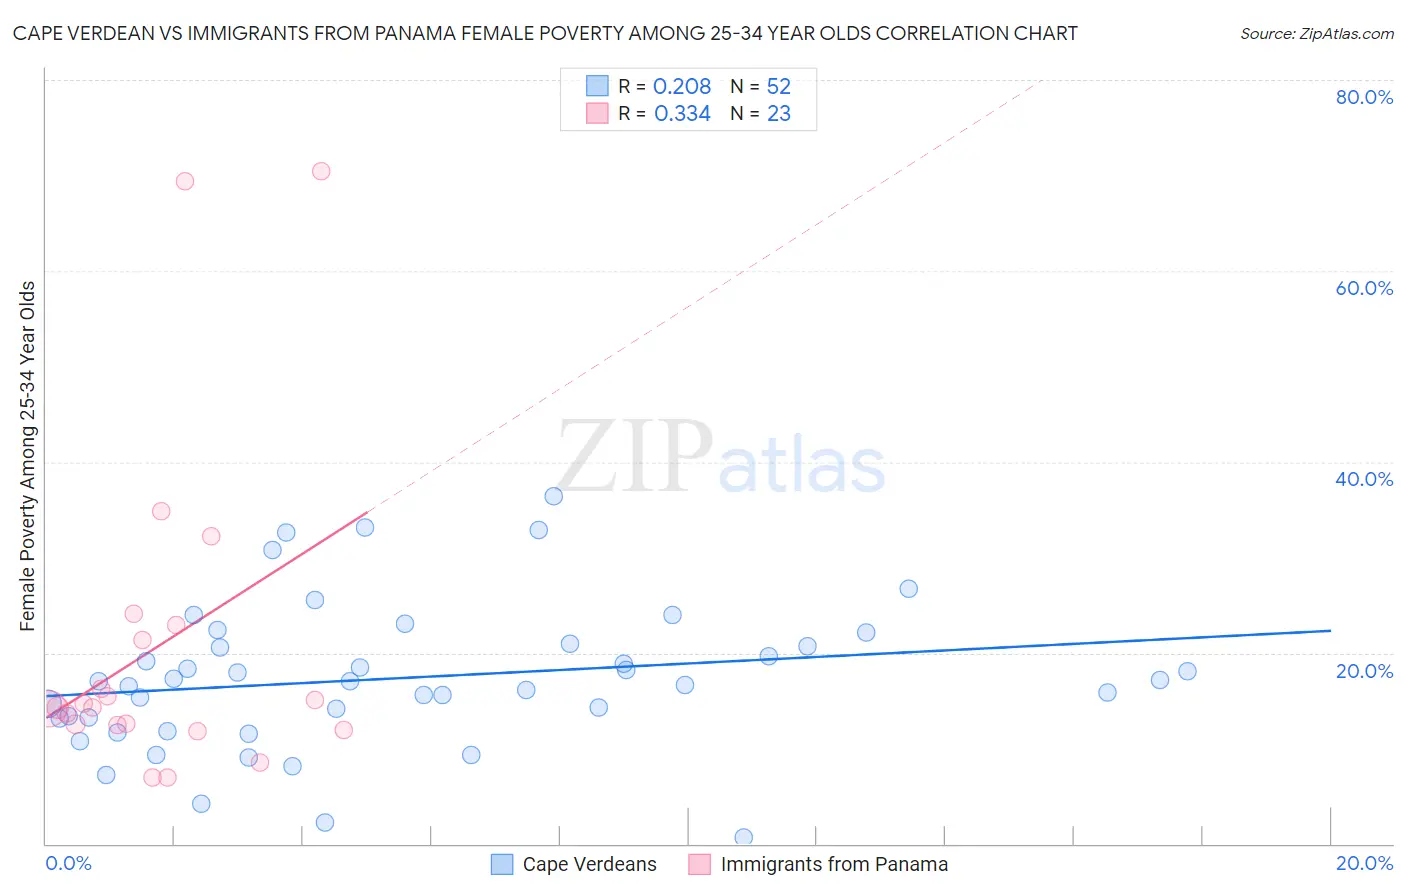
Cape Verdean vs Immigrants from Panama Female Poverty Among 25-34 Year Olds Correlation Chart
The statistical analysis conducted on geographies consisting of 106,950,464 people shows a weak positive correlation between the proportion of Cape Verdeans and poverty level among females between the ages 25 and 34 in the United States with a correlation coefficient (R) of 0.208 and weighted average of 16.3%. Similarly, the statistical analysis conducted on geographies consisting of 219,926,572 people shows a mild positive correlation between the proportion of Immigrants from Panama and poverty level among females between the ages 25 and 34 in the United States with a correlation coefficient (R) of 0.334 and weighted average of 14.1%, a difference of 15.9%.
Female Poverty Among 25-34 Year Olds Correlation Summary
| Measurement | Cape Verdean | Immigrants from Panama |
| Minimum | 0.71% | 7.0% |
| Maximum | 36.4% | 70.5% |
| Range | 35.7% | 63.5% |
| Mean | 17.4% | 20.7% |
| Median | 17.0% | 14.3% |
| Interquartile 25% (IQ1) | 13.2% | 12.4% |
| Interquartile 75% (IQ3) | 20.9% | 22.9% |
| Interquartile Range (IQR) | 7.7% | 10.5% |
| Standard Deviation (Sample) | 7.6% | 17.0% |
| Standard Deviation (Population) | 7.5% | 16.7% |
Similar Demographics by Female Poverty Among 25-34 Year Olds
Demographics Similar to Cape Verdeans by Female Poverty Among 25-34 Year Olds
In terms of female poverty among 25-34 year olds, the demographic groups most similar to Cape Verdeans are American (16.4%, a difference of 0.050%), Immigrants from Bahamas (16.3%, a difference of 0.18%), Guatemalan (16.4%, a difference of 0.24%), Osage (16.4%, a difference of 0.30%), and Indonesian (16.4%, a difference of 0.46%).
| Demographics | Rating | Rank | Female Poverty Among 25-34 Year Olds |
| Fijians | 0.0 /100 | #279 | Tragic 15.9% |
| Bangladeshis | 0.0 /100 | #280 | Tragic 15.9% |
| Immigrants | Latin America | 0.0 /100 | #281 | Tragic 16.0% |
| Aleuts | 0.0 /100 | #282 | Tragic 16.1% |
| Bahamians | 0.0 /100 | #283 | Tragic 16.1% |
| Shoshone | 0.0 /100 | #284 | Tragic 16.2% |
| Immigrants | Bahamas | 0.0 /100 | #285 | Tragic 16.3% |
| Cape Verdeans | 0.0 /100 | #286 | Tragic 16.3% |
| Americans | 0.0 /100 | #287 | Tragic 16.4% |
| Guatemalans | 0.0 /100 | #288 | Tragic 16.4% |
| Osage | 0.0 /100 | #289 | Tragic 16.4% |
| Indonesians | 0.0 /100 | #290 | Tragic 16.4% |
| Comanche | 0.0 /100 | #291 | Tragic 16.5% |
| Immigrants | Dominica | 0.0 /100 | #292 | Tragic 16.5% |
| Potawatomi | 0.0 /100 | #293 | Tragic 16.5% |
Demographics Similar to Immigrants from Panama by Female Poverty Among 25-34 Year Olds
In terms of female poverty among 25-34 year olds, the demographic groups most similar to Immigrants from Panama are Japanese (14.1%, a difference of 0.020%), Hungarian (14.1%, a difference of 0.040%), Immigrants from Africa (14.1%, a difference of 0.32%), Hawaiian (14.1%, a difference of 0.37%), and Immigrants (14.0%, a difference of 0.51%).
| Demographics | Rating | Rank | Female Poverty Among 25-34 Year Olds |
| Immigrants | Trinidad and Tobago | 17.6 /100 | #201 | Poor 14.0% |
| Welsh | 17.2 /100 | #202 | Poor 14.0% |
| Immigrants | Immigrants | 14.5 /100 | #203 | Poor 14.0% |
| Hawaiians | 13.6 /100 | #204 | Poor 14.1% |
| Immigrants | Africa | 13.4 /100 | #205 | Poor 14.1% |
| Hungarians | 11.8 /100 | #206 | Poor 14.1% |
| Japanese | 11.7 /100 | #207 | Poor 14.1% |
| Immigrants | Panama | 11.6 /100 | #208 | Poor 14.1% |
| Guyanese | 8.6 /100 | #209 | Tragic 14.2% |
| Panamanians | 8.6 /100 | #210 | Tragic 14.2% |
| Trinidadians and Tobagonians | 8.2 /100 | #211 | Tragic 14.2% |
| Immigrants | Guyana | 6.6 /100 | #212 | Tragic 14.3% |
| Puget Sound Salish | 6.5 /100 | #213 | Tragic 14.3% |
| French | 6.2 /100 | #214 | Tragic 14.3% |
| Immigrants | Nigeria | 6.2 /100 | #215 | Tragic 14.3% |