Inupiat vs Immigrants from Ireland Female Poverty Among 25-34 Year Olds
COMPARE
Inupiat
Immigrants from Ireland
Female Poverty Among 25-34 Year Olds
Female Poverty Among 25-34 Year Olds Comparison
Inupiat
Immigrants from Ireland
18.5%
FEMALE POVERTY AMONG 25-34 YEAR OLDS
0.0/ 100
METRIC RATING
325th/ 347
METRIC RANK
11.2%
FEMALE POVERTY AMONG 25-34 YEAR OLDS
100.0/ 100
METRIC RATING
12th/ 347
METRIC RANK
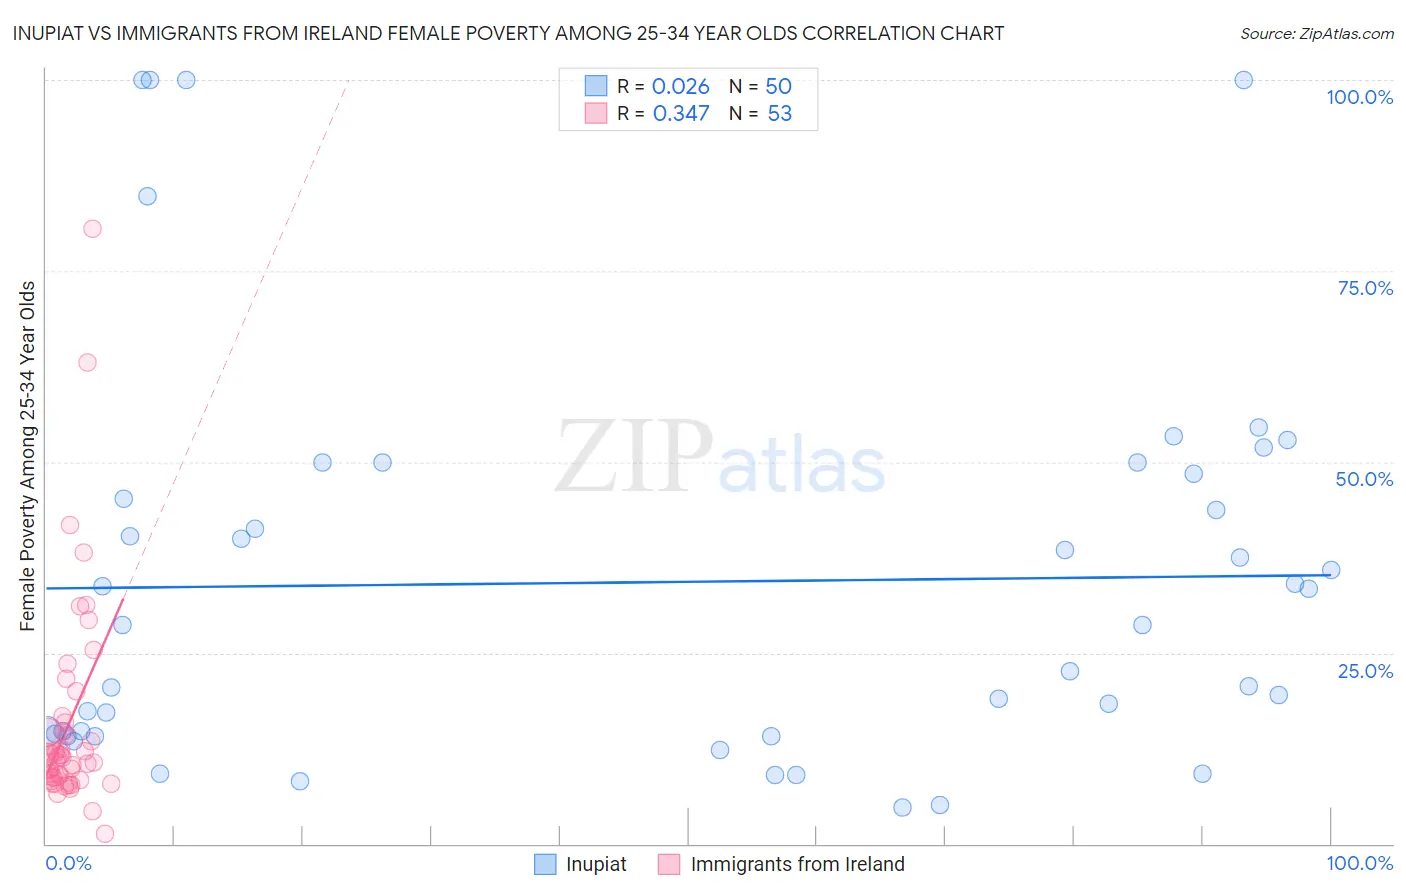
Inupiat vs Immigrants from Ireland Female Poverty Among 25-34 Year Olds Correlation Chart
The statistical analysis conducted on geographies consisting of 95,902,522 people shows no correlation between the proportion of Inupiat and poverty level among females between the ages 25 and 34 in the United States with a correlation coefficient (R) of 0.026 and weighted average of 18.5%. Similarly, the statistical analysis conducted on geographies consisting of 237,059,494 people shows a mild positive correlation between the proportion of Immigrants from Ireland and poverty level among females between the ages 25 and 34 in the United States with a correlation coefficient (R) of 0.347 and weighted average of 11.2%, a difference of 66.1%.
Female Poverty Among 25-34 Year Olds Correlation Summary
| Measurement | Inupiat | Immigrants from Ireland |
| Minimum | 4.7% | 1.4% |
| Maximum | 100.0% | 80.5% |
| Range | 95.3% | 79.1% |
| Mean | 34.2% | 15.6% |
| Median | 28.6% | 11.3% |
| Interquartile 25% (IQ1) | 14.4% | 8.5% |
| Interquartile 75% (IQ3) | 48.5% | 15.4% |
| Interquartile Range (IQR) | 34.1% | 6.9% |
| Standard Deviation (Sample) | 26.0% | 14.0% |
| Standard Deviation (Population) | 25.7% | 13.9% |
Similar Demographics by Female Poverty Among 25-34 Year Olds
Demographics Similar to Inupiat by Female Poverty Among 25-34 Year Olds
In terms of female poverty among 25-34 year olds, the demographic groups most similar to Inupiat are Dutch West Indian (18.4%, a difference of 0.52%), Seminole (18.3%, a difference of 1.5%), Central American Indian (18.2%, a difference of 1.8%), Black/African American (18.9%, a difference of 2.0%), and Choctaw (18.1%, a difference of 2.6%).
| Demographics | Rating | Rank | Female Poverty Among 25-34 Year Olds |
| Ute | 0.0 /100 | #318 | Tragic 17.9% |
| Menominee | 0.0 /100 | #319 | Tragic 18.0% |
| Chippewa | 0.0 /100 | #320 | Tragic 18.0% |
| Choctaw | 0.0 /100 | #321 | Tragic 18.1% |
| Central American Indians | 0.0 /100 | #322 | Tragic 18.2% |
| Seminole | 0.0 /100 | #323 | Tragic 18.3% |
| Dutch West Indians | 0.0 /100 | #324 | Tragic 18.4% |
| Inupiat | 0.0 /100 | #325 | Tragic 18.5% |
| Blacks/African Americans | 0.0 /100 | #326 | Tragic 18.9% |
| Cheyenne | 0.0 /100 | #327 | Tragic 19.1% |
| Alaskan Athabascans | 0.0 /100 | #328 | Tragic 19.1% |
| Creek | 0.0 /100 | #329 | Tragic 19.2% |
| Paiute | 0.0 /100 | #330 | Tragic 19.6% |
| Kiowa | 0.0 /100 | #331 | Tragic 19.7% |
| Immigrants | Yemen | 0.0 /100 | #332 | Tragic 19.8% |
Demographics Similar to Immigrants from Ireland by Female Poverty Among 25-34 Year Olds
In terms of female poverty among 25-34 year olds, the demographic groups most similar to Immigrants from Ireland are Burmese (11.2%, a difference of 0.11%), Indian (Asian) (11.2%, a difference of 0.11%), Immigrants from Korea (11.1%, a difference of 0.13%), Assyrian/Chaldean/Syriac (11.2%, a difference of 0.22%), and Immigrants from Bolivia (11.2%, a difference of 0.26%).
| Demographics | Rating | Rank | Female Poverty Among 25-34 Year Olds |
| Immigrants | Hong Kong | 100.0 /100 | #5 | Exceptional 10.4% |
| Immigrants | South Central Asia | 100.0 /100 | #6 | Exceptional 10.8% |
| Chinese | 100.0 /100 | #7 | Exceptional 11.0% |
| Immigrants | Iran | 100.0 /100 | #8 | Exceptional 11.0% |
| Immigrants | Singapore | 100.0 /100 | #9 | Exceptional 11.1% |
| Immigrants | Lithuania | 100.0 /100 | #10 | Exceptional 11.1% |
| Immigrants | Korea | 100.0 /100 | #11 | Exceptional 11.1% |
| Immigrants | Ireland | 100.0 /100 | #12 | Exceptional 11.2% |
| Burmese | 100.0 /100 | #13 | Exceptional 11.2% |
| Indians (Asian) | 100.0 /100 | #14 | Exceptional 11.2% |
| Assyrians/Chaldeans/Syriacs | 100.0 /100 | #15 | Exceptional 11.2% |
| Immigrants | Bolivia | 100.0 /100 | #16 | Exceptional 11.2% |
| Immigrants | China | 100.0 /100 | #17 | Exceptional 11.2% |
| Immigrants | Eastern Asia | 100.0 /100 | #18 | Exceptional 11.2% |
| Iranians | 100.0 /100 | #19 | Exceptional 11.2% |