Inupiat vs Immigrants from Eastern Europe Receiving Food Stamps
COMPARE
Inupiat
Immigrants from Eastern Europe
Receiving Food Stamps
Receiving Food Stamps Comparison
Inupiat
Immigrants from Eastern Europe
20.1%
RECEIVING FOOD STAMPS
0.0/ 100
METRIC RATING
333rd/ 347
METRIC RANK
10.8%
RECEIVING FOOD STAMPS
89.8/ 100
METRIC RATING
137th/ 347
METRIC RANK
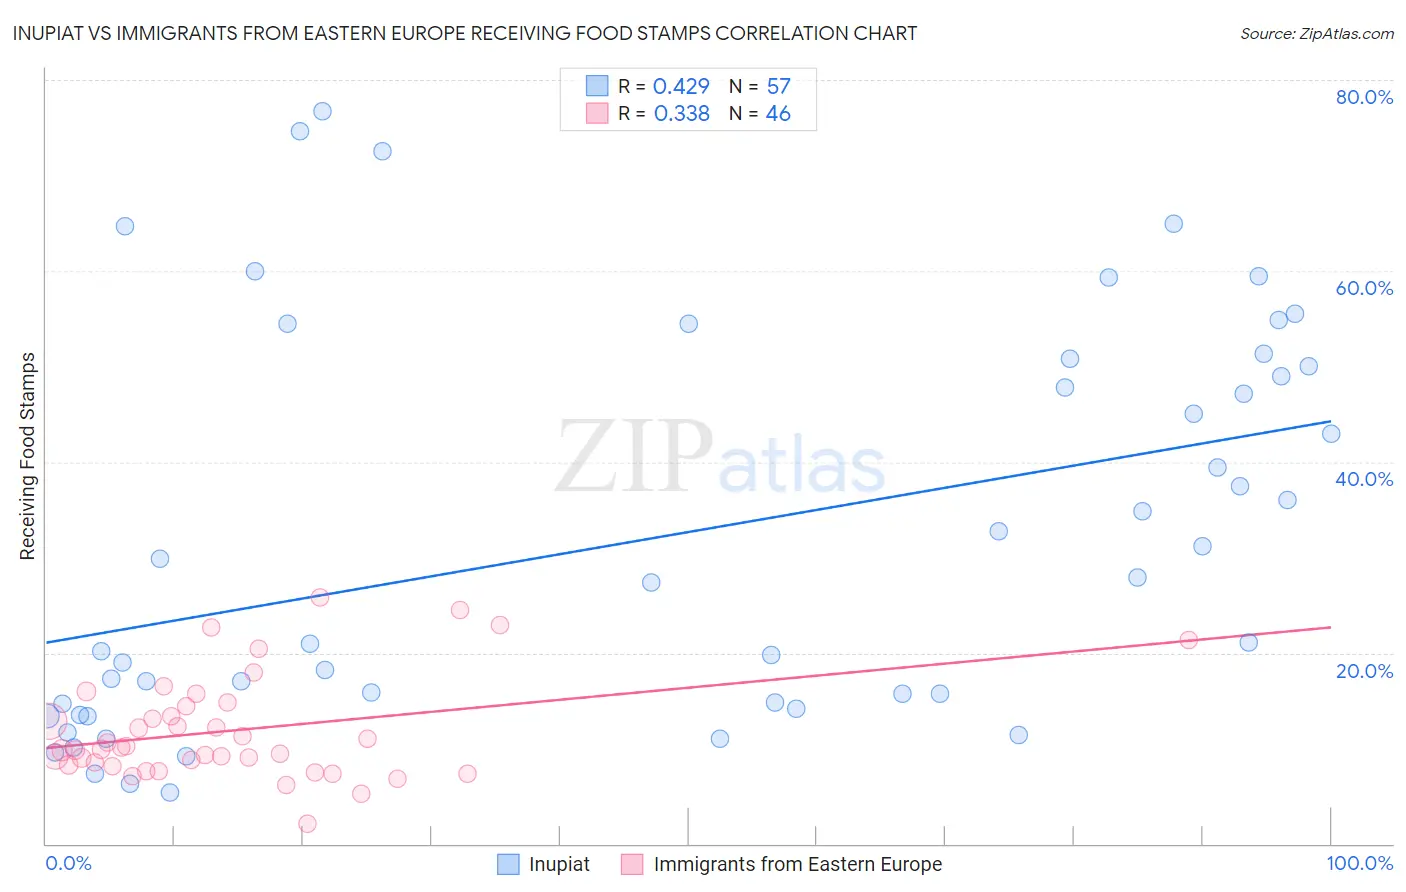
Inupiat vs Immigrants from Eastern Europe Receiving Food Stamps Correlation Chart
The statistical analysis conducted on geographies consisting of 96,290,078 people shows a moderate positive correlation between the proportion of Inupiat and percentage of population receiving government assistance and/or food stamps in the United States with a correlation coefficient (R) of 0.429 and weighted average of 20.1%. Similarly, the statistical analysis conducted on geographies consisting of 473,642,116 people shows a mild positive correlation between the proportion of Immigrants from Eastern Europe and percentage of population receiving government assistance and/or food stamps in the United States with a correlation coefficient (R) of 0.338 and weighted average of 10.8%, a difference of 84.9%.
Receiving Food Stamps Correlation Summary
| Measurement | Inupiat | Immigrants from Eastern Europe |
| Minimum | 5.4% | 2.1% |
| Maximum | 76.7% | 25.8% |
| Range | 71.3% | 23.7% |
| Mean | 32.0% | 11.9% |
| Median | 27.3% | 10.0% |
| Interquartile 25% (IQ1) | 14.4% | 8.3% |
| Interquartile 75% (IQ3) | 50.4% | 14.4% |
| Interquartile Range (IQR) | 36.0% | 6.1% |
| Standard Deviation (Sample) | 20.6% | 5.4% |
| Standard Deviation (Population) | 20.4% | 5.3% |
Similar Demographics by Receiving Food Stamps
Demographics Similar to Inupiat by Receiving Food Stamps
In terms of receiving food stamps, the demographic groups most similar to Inupiat are Pueblo (19.9%, a difference of 0.73%), Yuman (20.2%, a difference of 0.86%), Immigrants from Caribbean (19.6%, a difference of 2.2%), Immigrants from Cuba (20.8%, a difference of 3.8%), and Navajo (21.1%, a difference of 5.0%).
| Demographics | Rating | Rank | Receiving Food Stamps |
| Cubans | 0.0 /100 | #326 | Tragic 18.2% |
| Apache | 0.0 /100 | #327 | Tragic 18.3% |
| Colville | 0.0 /100 | #328 | Tragic 18.3% |
| Immigrants | Dominica | 0.0 /100 | #329 | Tragic 18.4% |
| Pima | 0.0 /100 | #330 | Tragic 19.0% |
| Immigrants | Caribbean | 0.0 /100 | #331 | Tragic 19.6% |
| Pueblo | 0.0 /100 | #332 | Tragic 19.9% |
| Inupiat | 0.0 /100 | #333 | Tragic 20.1% |
| Yuman | 0.0 /100 | #334 | Tragic 20.2% |
| Immigrants | Cuba | 0.0 /100 | #335 | Tragic 20.8% |
| Navajo | 0.0 /100 | #336 | Tragic 21.1% |
| Cape Verdeans | 0.0 /100 | #337 | Tragic 21.1% |
| Dominicans | 0.0 /100 | #338 | Tragic 21.4% |
| Yakama | 0.0 /100 | #339 | Tragic 21.4% |
| Tohono O'odham | 0.0 /100 | #340 | Tragic 21.5% |
Demographics Similar to Immigrants from Eastern Europe by Receiving Food Stamps
In terms of receiving food stamps, the demographic groups most similar to Immigrants from Eastern Europe are Slovak (10.8%, a difference of 0.020%), Argentinean (10.8%, a difference of 0.19%), Immigrants from Brazil (10.8%, a difference of 0.21%), Immigrants from Russia (10.8%, a difference of 0.51%), and Immigrants from Moldova (10.9%, a difference of 0.51%).
| Demographics | Rating | Rank | Receiving Food Stamps |
| Israelis | 92.4 /100 | #130 | Exceptional 10.7% |
| French | 92.3 /100 | #131 | Exceptional 10.7% |
| Immigrants | Germany | 92.0 /100 | #132 | Exceptional 10.7% |
| Immigrants | Russia | 90.9 /100 | #133 | Exceptional 10.8% |
| Immigrants | Brazil | 90.3 /100 | #134 | Exceptional 10.8% |
| Argentineans | 90.2 /100 | #135 | Exceptional 10.8% |
| Slovaks | 89.8 /100 | #136 | Excellent 10.8% |
| Immigrants | Eastern Europe | 89.8 /100 | #137 | Excellent 10.8% |
| Immigrants | Moldova | 88.5 /100 | #138 | Excellent 10.9% |
| Hmong | 88.4 /100 | #139 | Excellent 10.9% |
| Celtics | 87.8 /100 | #140 | Excellent 10.9% |
| Immigrants | Vietnam | 86.7 /100 | #141 | Excellent 11.0% |
| Chileans | 86.2 /100 | #142 | Excellent 11.0% |
| Immigrants | Northern Africa | 86.0 /100 | #143 | Excellent 11.0% |
| Syrians | 85.5 /100 | #144 | Excellent 11.0% |