Haitian vs Puerto Rican Family Poverty
COMPARE
Haitian
Puerto Rican
Family Poverty
Family Poverty Comparison
Haitians
Puerto Ricans
11.5%
FAMILY POVERTY
0.0/ 100
METRIC RATING
291st/ 347
METRIC RANK
20.3%
FAMILY POVERTY
0.0/ 100
METRIC RATING
346th/ 347
METRIC RANK
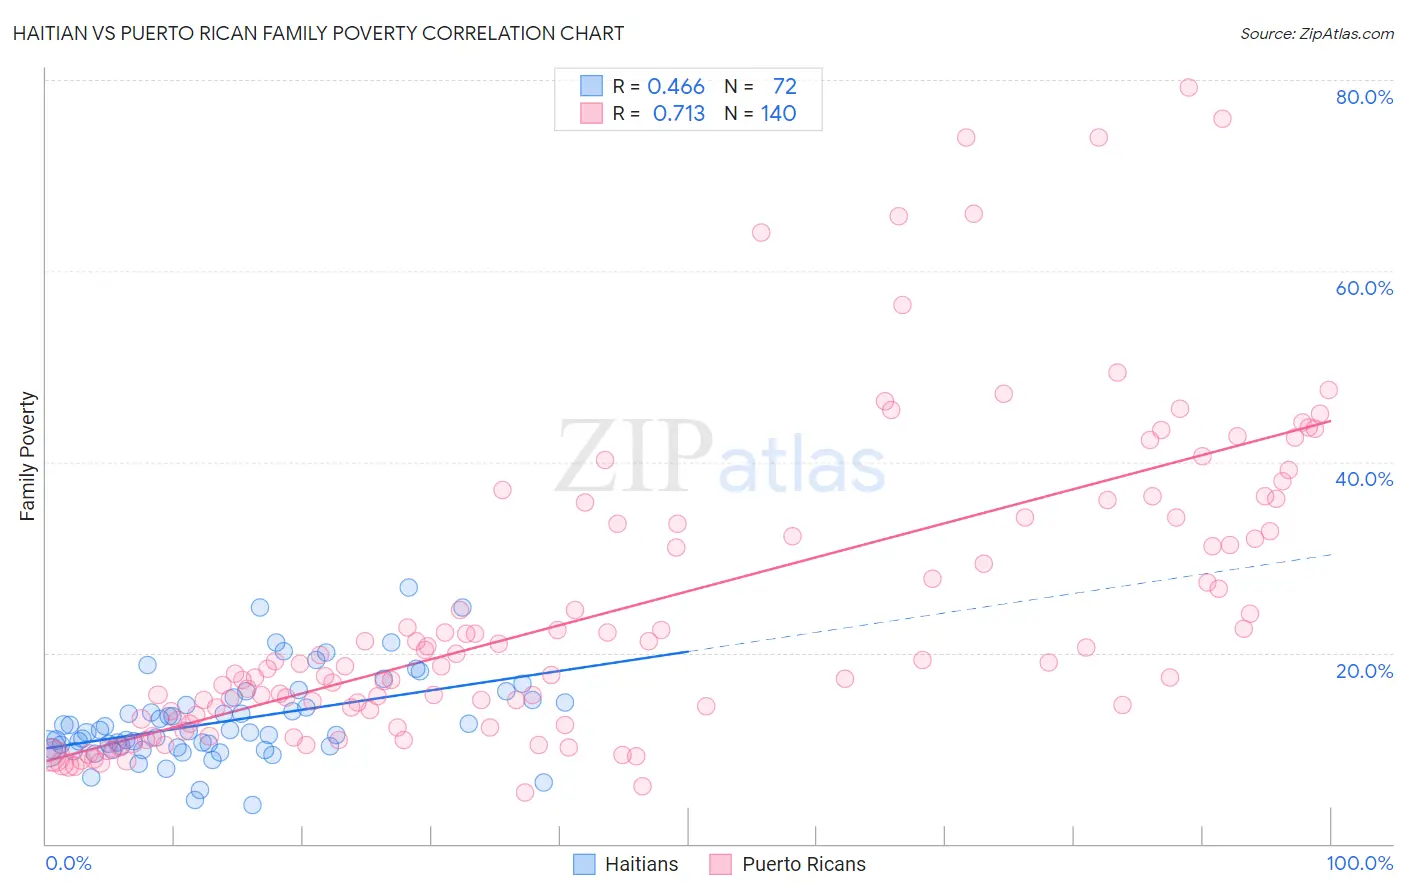
Haitian vs Puerto Rican Family Poverty Correlation Chart
The statistical analysis conducted on geographies consisting of 287,320,460 people shows a moderate positive correlation between the proportion of Haitians and poverty level among families in the United States with a correlation coefficient (R) of 0.466 and weighted average of 11.5%. Similarly, the statistical analysis conducted on geographies consisting of 525,427,340 people shows a strong positive correlation between the proportion of Puerto Ricans and poverty level among families in the United States with a correlation coefficient (R) of 0.713 and weighted average of 20.3%, a difference of 76.2%.
Family Poverty Correlation Summary
| Measurement | Haitian | Puerto Rican |
| Minimum | 4.1% | 5.3% |
| Maximum | 26.8% | 79.2% |
| Range | 22.8% | 73.9% |
| Mean | 12.9% | 24.4% |
| Median | 11.7% | 18.7% |
| Interquartile 25% (IQ1) | 10.0% | 13.3% |
| Interquartile 75% (IQ3) | 14.9% | 33.5% |
| Interquartile Range (IQR) | 4.9% | 20.2% |
| Standard Deviation (Sample) | 4.5% | 15.9% |
| Standard Deviation (Population) | 4.5% | 15.9% |
Similar Demographics by Family Poverty
Demographics Similar to Haitians by Family Poverty
In terms of family poverty, the demographic groups most similar to Haitians are West Indian (11.5%, a difference of 0.060%), Immigrants from Barbados (11.5%, a difference of 0.070%), Immigrants from Somalia (11.5%, a difference of 0.11%), Immigrants from Belize (11.5%, a difference of 0.12%), and Vietnamese (11.5%, a difference of 0.31%).
| Demographics | Rating | Rank | Family Poverty |
| Yaqui | 0.0 /100 | #284 | Tragic 11.3% |
| Barbadians | 0.0 /100 | #285 | Tragic 11.3% |
| Senegalese | 0.0 /100 | #286 | Tragic 11.5% |
| Vietnamese | 0.0 /100 | #287 | Tragic 11.5% |
| Immigrants | Belize | 0.0 /100 | #288 | Tragic 11.5% |
| Immigrants | Barbados | 0.0 /100 | #289 | Tragic 11.5% |
| West Indians | 0.0 /100 | #290 | Tragic 11.5% |
| Haitians | 0.0 /100 | #291 | Tragic 11.5% |
| Immigrants | Somalia | 0.0 /100 | #292 | Tragic 11.5% |
| Immigrants | Cabo Verde | 0.0 /100 | #293 | Tragic 11.6% |
| Immigrants | St. Vincent and the Grenadines | 0.0 /100 | #294 | Tragic 11.6% |
| Immigrants | Haiti | 0.0 /100 | #295 | Tragic 11.6% |
| Choctaw | 0.0 /100 | #296 | Tragic 11.6% |
| Creek | 0.0 /100 | #297 | Tragic 11.7% |
| Immigrants | Senegal | 0.0 /100 | #298 | Tragic 11.7% |
Demographics Similar to Puerto Ricans by Family Poverty
In terms of family poverty, the demographic groups most similar to Puerto Ricans are Tohono O'odham (20.4%, a difference of 0.37%), Navajo (18.8%, a difference of 8.1%), Yup'ik (18.7%, a difference of 8.6%), Pima (18.4%, a difference of 10.6%), and Immigrants from Yemen (17.5%, a difference of 16.4%).
| Demographics | Rating | Rank | Family Poverty |
| Immigrants | Dominican Republic | 0.0 /100 | #333 | Tragic 14.4% |
| Houma | 0.0 /100 | #334 | Tragic 14.6% |
| Apache | 0.0 /100 | #335 | Tragic 14.7% |
| Sioux | 0.0 /100 | #336 | Tragic 15.9% |
| Hopi | 0.0 /100 | #337 | Tragic 15.9% |
| Crow | 0.0 /100 | #338 | Tragic 16.1% |
| Yuman | 0.0 /100 | #339 | Tragic 16.6% |
| Pueblo | 0.0 /100 | #340 | Tragic 17.0% |
| Lumbee | 0.0 /100 | #341 | Tragic 17.0% |
| Immigrants | Yemen | 0.0 /100 | #342 | Tragic 17.5% |
| Pima | 0.0 /100 | #343 | Tragic 18.4% |
| Yup'ik | 0.0 /100 | #344 | Tragic 18.7% |
| Navajo | 0.0 /100 | #345 | Tragic 18.8% |
| Puerto Ricans | 0.0 /100 | #346 | Tragic 20.3% |
| Tohono O'odham | 0.0 /100 | #347 | Tragic 20.4% |