Hmong vs Immigrants from Zimbabwe Female Poverty Among 18-24 Year Olds
COMPARE
Hmong
Immigrants from Zimbabwe
Female Poverty Among 18-24 Year Olds
Female Poverty Among 18-24 Year Olds Comparison
Hmong
Immigrants from Zimbabwe
20.0%
FEMALE POVERTY AMONG 18-24 YEAR OLDS
55.4/ 100
METRIC RATING
169th/ 347
METRIC RANK
19.8%
FEMALE POVERTY AMONG 18-24 YEAR OLDS
76.7/ 100
METRIC RATING
154th/ 347
METRIC RANK
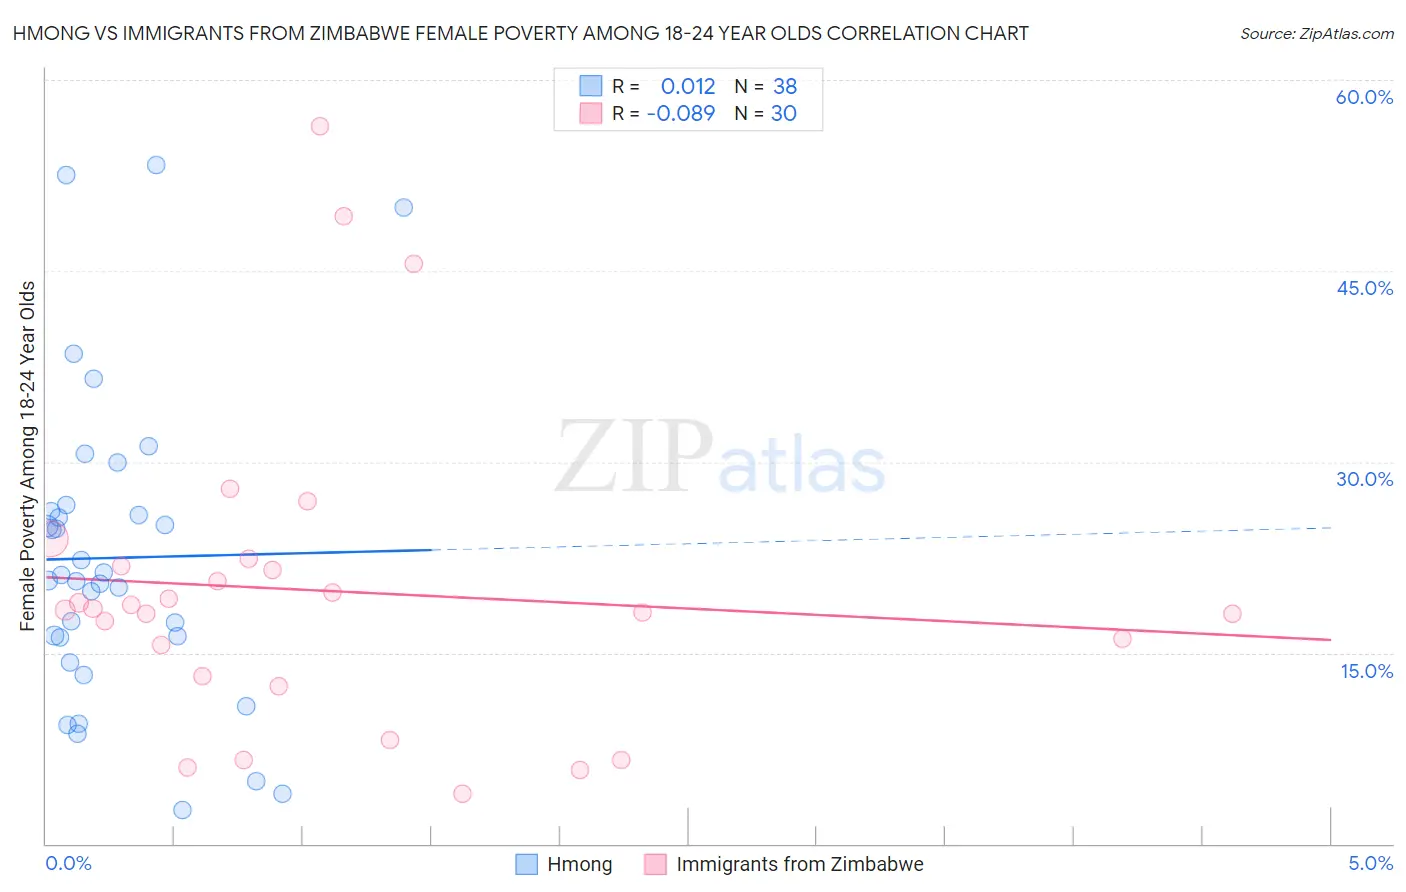
Hmong vs Immigrants from Zimbabwe Female Poverty Among 18-24 Year Olds Correlation Chart
The statistical analysis conducted on geographies consisting of 24,664,746 people shows no correlation between the proportion of Hmong and poverty level among females between the ages 18 and 24 in the United States with a correlation coefficient (R) of 0.012 and weighted average of 20.0%. Similarly, the statistical analysis conducted on geographies consisting of 116,895,909 people shows a slight negative correlation between the proportion of Immigrants from Zimbabwe and poverty level among females between the ages 18 and 24 in the United States with a correlation coefficient (R) of -0.089 and weighted average of 19.8%, a difference of 1.2%.
Female Poverty Among 18-24 Year Olds Correlation Summary
| Measurement | Hmong | Immigrants from Zimbabwe |
| Minimum | 2.6% | 3.9% |
| Maximum | 53.3% | 56.3% |
| Range | 50.7% | 52.4% |
| Mean | 22.5% | 19.9% |
| Median | 20.9% | 18.4% |
| Interquartile 25% (IQ1) | 16.2% | 13.2% |
| Interquartile 75% (IQ3) | 26.1% | 21.8% |
| Interquartile Range (IQR) | 9.9% | 8.6% |
| Standard Deviation (Sample) | 12.1% | 12.2% |
| Standard Deviation (Population) | 11.9% | 12.0% |
Demographics Similar to Hmong and Immigrants from Zimbabwe by Female Poverty Among 18-24 Year Olds
In terms of female poverty among 18-24 year olds, the demographic groups most similar to Hmong are Iranian (20.1%, a difference of 0.040%), Immigrants from Nigeria (20.1%, a difference of 0.060%), Fijian (20.0%, a difference of 0.19%), Czechoslovakian (20.0%, a difference of 0.32%), and Belgian (19.9%, a difference of 0.72%). Similarly, the demographic groups most similar to Immigrants from Zimbabwe are Hungarian (19.8%, a difference of 0.0%), Immigrants from Belgium (19.8%, a difference of 0.020%), Danish (19.8%, a difference of 0.080%), Immigrants from Lebanon (19.8%, a difference of 0.090%), and Immigrants from Japan (19.8%, a difference of 0.10%).
| Demographics | Rating | Rank | Female Poverty Among 18-24 Year Olds |
| Immigrants | Eastern Asia | 79.7 /100 | #151 | Good 19.8% |
| Yugoslavians | 79.0 /100 | #152 | Good 19.8% |
| Immigrants | Japan | 78.1 /100 | #153 | Good 19.8% |
| Immigrants | Zimbabwe | 76.7 /100 | #154 | Good 19.8% |
| Hungarians | 76.6 /100 | #155 | Good 19.8% |
| Immigrants | Belgium | 76.4 /100 | #156 | Good 19.8% |
| Danes | 75.5 /100 | #157 | Good 19.8% |
| Immigrants | Lebanon | 75.3 /100 | #158 | Good 19.8% |
| Trinidadians and Tobagonians | 74.4 /100 | #159 | Good 19.8% |
| Pakistanis | 74.1 /100 | #160 | Good 19.8% |
| Immigrants | Belize | 74.1 /100 | #161 | Good 19.8% |
| French Canadians | 73.0 /100 | #162 | Good 19.9% |
| Malaysians | 72.7 /100 | #163 | Good 19.9% |
| Central Americans | 70.0 /100 | #164 | Good 19.9% |
| Eastern Europeans | 69.3 /100 | #165 | Good 19.9% |
| Belgians | 69.1 /100 | #166 | Good 19.9% |
| Czechoslovakians | 61.8 /100 | #167 | Good 20.0% |
| Fijians | 59.1 /100 | #168 | Average 20.0% |
| Hmong | 55.4 /100 | #169 | Average 20.0% |
| Iranians | 54.7 /100 | #170 | Average 20.1% |
| Immigrants | Nigeria | 54.3 /100 | #171 | Average 20.1% |