Alaskan Athabascan vs Immigrants from Ecuador Female Poverty Among 18-24 Year Olds
COMPARE
Alaskan Athabascan
Immigrants from Ecuador
Female Poverty Among 18-24 Year Olds
Female Poverty Among 18-24 Year Olds Comparison
Alaskan Athabascans
Immigrants from Ecuador
22.5%
FEMALE POVERTY AMONG 18-24 YEAR OLDS
0.0/ 100
METRIC RATING
292nd/ 347
METRIC RANK
19.2%
FEMALE POVERTY AMONG 18-24 YEAR OLDS
97.8/ 100
METRIC RATING
105th/ 347
METRIC RANK
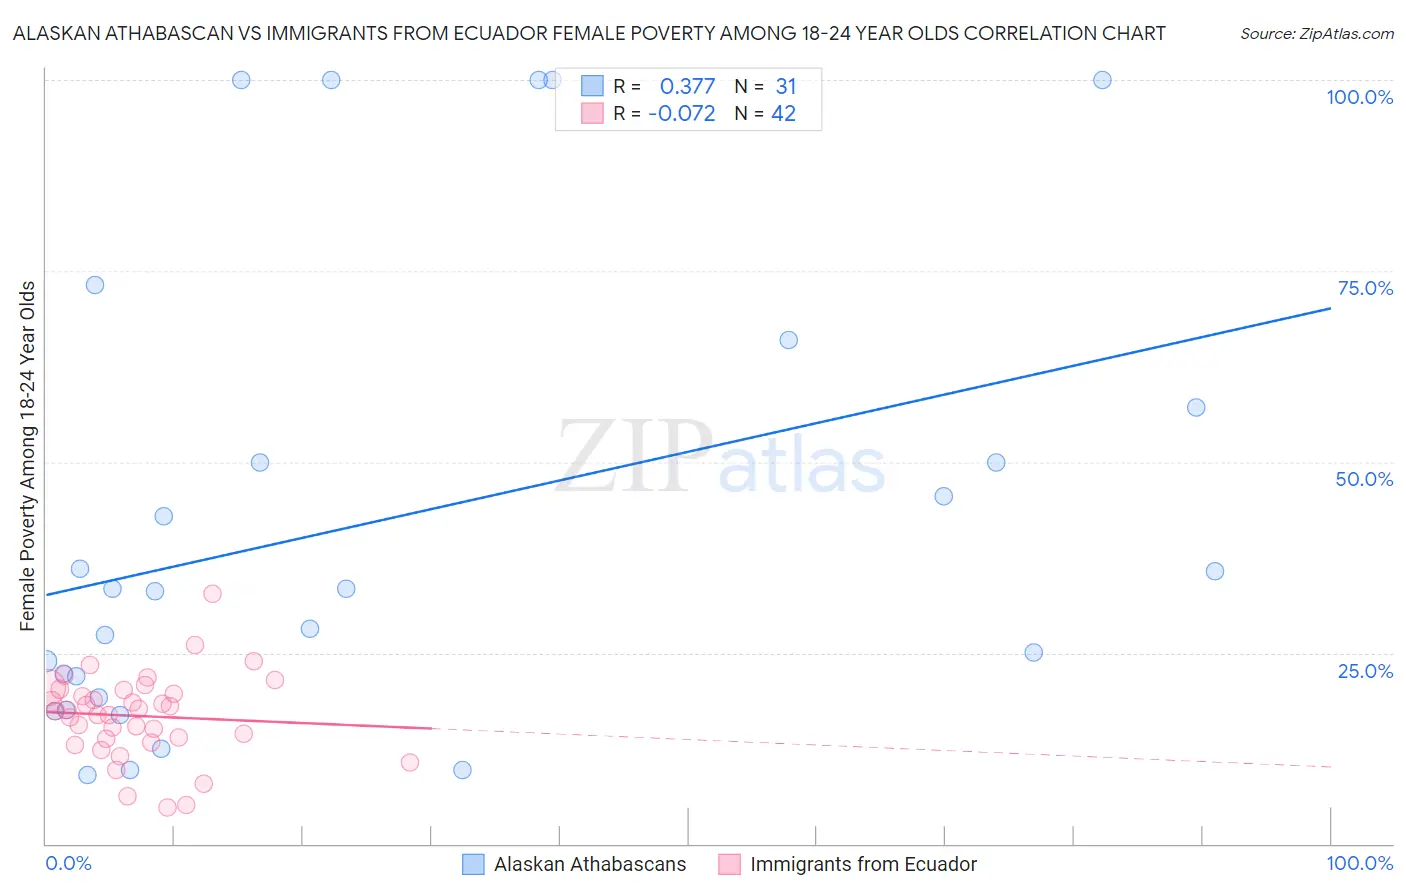
Alaskan Athabascan vs Immigrants from Ecuador Female Poverty Among 18-24 Year Olds Correlation Chart
The statistical analysis conducted on geographies consisting of 45,408,377 people shows a mild positive correlation between the proportion of Alaskan Athabascans and poverty level among females between the ages 18 and 24 in the United States with a correlation coefficient (R) of 0.377 and weighted average of 22.5%. Similarly, the statistical analysis conducted on geographies consisting of 266,188,241 people shows a slight negative correlation between the proportion of Immigrants from Ecuador and poverty level among females between the ages 18 and 24 in the United States with a correlation coefficient (R) of -0.072 and weighted average of 19.2%, a difference of 17.3%.
Female Poverty Among 18-24 Year Olds Correlation Summary
| Measurement | Alaskan Athabascan | Immigrants from Ecuador |
| Minimum | 9.0% | 4.7% |
| Maximum | 100.0% | 32.8% |
| Range | 91.0% | 28.1% |
| Mean | 42.5% | 16.7% |
| Median | 33.3% | 17.5% |
| Interquartile 25% (IQ1) | 19.2% | 13.7% |
| Interquartile 75% (IQ3) | 57.1% | 20.2% |
| Interquartile Range (IQR) | 37.9% | 6.5% |
| Standard Deviation (Sample) | 30.1% | 5.5% |
| Standard Deviation (Population) | 29.7% | 5.5% |
Similar Demographics by Female Poverty Among 18-24 Year Olds
Demographics Similar to Alaskan Athabascans by Female Poverty Among 18-24 Year Olds
In terms of female poverty among 18-24 year olds, the demographic groups most similar to Alaskan Athabascans are U.S. Virgin Islander (22.5%, a difference of 0.030%), Bangladeshi (22.5%, a difference of 0.050%), Indonesian (22.5%, a difference of 0.070%), Shoshone (22.5%, a difference of 0.19%), and Menominee (22.5%, a difference of 0.30%).
| Demographics | Rating | Rank | Female Poverty Among 18-24 Year Olds |
| Ottawa | 0.0 /100 | #285 | Tragic 22.0% |
| Ugandans | 0.0 /100 | #286 | Tragic 22.1% |
| Immigrants | Middle Africa | 0.0 /100 | #287 | Tragic 22.1% |
| Dominicans | 0.0 /100 | #288 | Tragic 22.3% |
| French American Indians | 0.0 /100 | #289 | Tragic 22.3% |
| Immigrants | Senegal | 0.0 /100 | #290 | Tragic 22.4% |
| Bangladeshis | 0.0 /100 | #291 | Tragic 22.5% |
| Alaskan Athabascans | 0.0 /100 | #292 | Tragic 22.5% |
| U.S. Virgin Islanders | 0.0 /100 | #293 | Tragic 22.5% |
| Indonesians | 0.0 /100 | #294 | Tragic 22.5% |
| Shoshone | 0.0 /100 | #295 | Tragic 22.5% |
| Menominee | 0.0 /100 | #296 | Tragic 22.5% |
| Inupiat | 0.0 /100 | #297 | Tragic 22.6% |
| Central American Indians | 0.0 /100 | #298 | Tragic 22.6% |
| Cherokee | 0.0 /100 | #299 | Tragic 22.7% |
Demographics Similar to Immigrants from Ecuador by Female Poverty Among 18-24 Year Olds
In terms of female poverty among 18-24 year olds, the demographic groups most similar to Immigrants from Ecuador are Immigrants from Sierra Leone (19.2%, a difference of 0.040%), Immigrants from Afghanistan (19.1%, a difference of 0.090%), Serbian (19.1%, a difference of 0.13%), Immigrants from Caribbean (19.1%, a difference of 0.17%), and Ecuadorian (19.1%, a difference of 0.19%).
| Demographics | Rating | Rank | Female Poverty Among 18-24 Year Olds |
| Immigrants | Jordan | 98.4 /100 | #98 | Exceptional 19.1% |
| Immigrants | Czechoslovakia | 98.3 /100 | #99 | Exceptional 19.1% |
| Chileans | 98.3 /100 | #100 | Exceptional 19.1% |
| Ecuadorians | 98.1 /100 | #101 | Exceptional 19.1% |
| Immigrants | Caribbean | 98.1 /100 | #102 | Exceptional 19.1% |
| Serbians | 98.0 /100 | #103 | Exceptional 19.1% |
| Immigrants | Afghanistan | 98.0 /100 | #104 | Exceptional 19.1% |
| Immigrants | Ecuador | 97.8 /100 | #105 | Exceptional 19.2% |
| Immigrants | Sierra Leone | 97.8 /100 | #106 | Exceptional 19.2% |
| Immigrants | Sri Lanka | 97.5 /100 | #107 | Exceptional 19.2% |
| Immigrants | Uzbekistan | 97.3 /100 | #108 | Exceptional 19.2% |
| Immigrants | Syria | 97.2 /100 | #109 | Exceptional 19.2% |
| Laotians | 97.1 /100 | #110 | Exceptional 19.2% |
| Immigrants | Serbia | 97.1 /100 | #111 | Exceptional 19.2% |
| Immigrants | El Salvador | 96.5 /100 | #112 | Exceptional 19.3% |