Indian (Asian) vs Bulgarian Female Poverty Among 18-24 Year Olds
COMPARE
Indian (Asian)
Bulgarian
Female Poverty Among 18-24 Year Olds
Female Poverty Among 18-24 Year Olds Comparison
Indians (Asian)
Bulgarians
19.6%
FEMALE POVERTY AMONG 18-24 YEAR OLDS
88.3/ 100
METRIC RATING
139th/ 347
METRIC RANK
18.1%
FEMALE POVERTY AMONG 18-24 YEAR OLDS
100.0/ 100
METRIC RATING
42nd/ 347
METRIC RANK
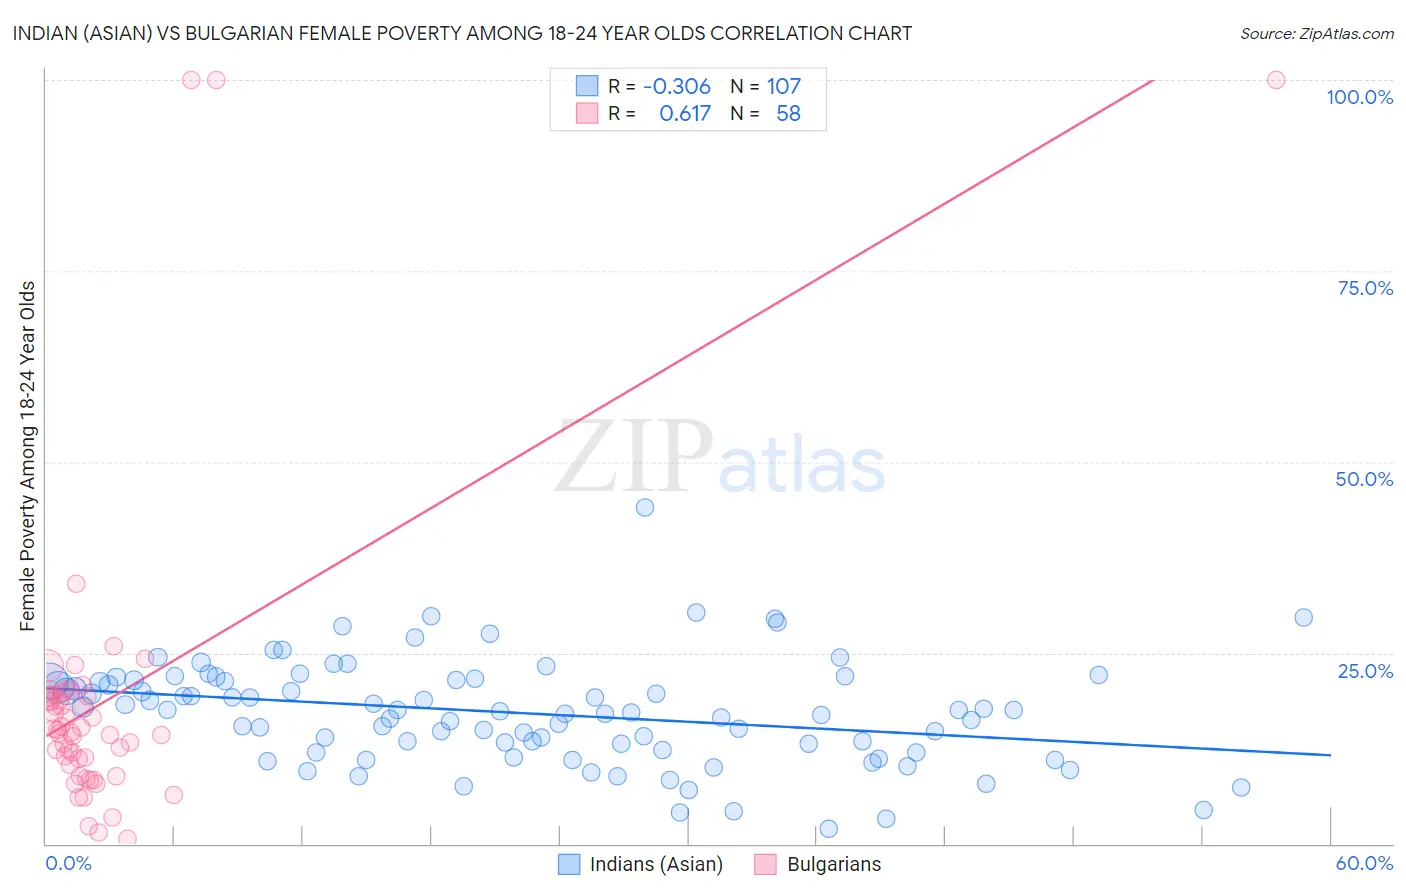
Indian (Asian) vs Bulgarian Female Poverty Among 18-24 Year Olds Correlation Chart
The statistical analysis conducted on geographies consisting of 476,846,332 people shows a mild negative correlation between the proportion of Indians (Asian) and poverty level among females between the ages 18 and 24 in the United States with a correlation coefficient (R) of -0.306 and weighted average of 19.6%. Similarly, the statistical analysis conducted on geographies consisting of 202,813,744 people shows a significant positive correlation between the proportion of Bulgarians and poverty level among females between the ages 18 and 24 in the United States with a correlation coefficient (R) of 0.617 and weighted average of 18.1%, a difference of 8.4%.
Female Poverty Among 18-24 Year Olds Correlation Summary
| Measurement | Indian (Asian) | Bulgarian |
| Minimum | 2.0% | 0.62% |
| Maximum | 44.1% | 100.0% |
| Range | 42.1% | 99.4% |
| Mean | 17.1% | 18.8% |
| Median | 17.4% | 14.7% |
| Interquartile 25% (IQ1) | 12.3% | 10.4% |
| Interquartile 75% (IQ3) | 21.4% | 19.4% |
| Interquartile Range (IQR) | 9.1% | 9.0% |
| Standard Deviation (Sample) | 6.8% | 20.2% |
| Standard Deviation (Population) | 6.8% | 20.0% |
Similar Demographics by Female Poverty Among 18-24 Year Olds
Demographics Similar to Indians (Asian) by Female Poverty Among 18-24 Year Olds
In terms of female poverty among 18-24 year olds, the demographic groups most similar to Indians (Asian) are Immigrants from Morocco (19.6%, a difference of 0.20%), Immigrants from Trinidad and Tobago (19.7%, a difference of 0.30%), Pennsylvania German (19.7%, a difference of 0.31%), Austrian (19.5%, a difference of 0.32%), and Panamanian (19.7%, a difference of 0.41%).
| Demographics | Rating | Rank | Female Poverty Among 18-24 Year Olds |
| Jamaicans | 92.1 /100 | #132 | Exceptional 19.5% |
| Turks | 92.1 /100 | #133 | Exceptional 19.5% |
| Immigrants | North America | 92.1 /100 | #134 | Exceptional 19.5% |
| Soviet Union | 92.0 /100 | #135 | Exceptional 19.5% |
| Russians | 91.5 /100 | #136 | Exceptional 19.5% |
| Austrians | 90.7 /100 | #137 | Exceptional 19.5% |
| Immigrants | Morocco | 89.9 /100 | #138 | Excellent 19.6% |
| Indians (Asian) | 88.3 /100 | #139 | Excellent 19.6% |
| Immigrants | Trinidad and Tobago | 85.6 /100 | #140 | Excellent 19.7% |
| Pennsylvania Germans | 85.5 /100 | #141 | Excellent 19.7% |
| Panamanians | 84.6 /100 | #142 | Excellent 19.7% |
| Slavs | 84.4 /100 | #143 | Excellent 19.7% |
| Immigrants | Northern Africa | 84.1 /100 | #144 | Excellent 19.7% |
| Canadians | 83.8 /100 | #145 | Excellent 19.7% |
| Immigrants | Bosnia and Herzegovina | 83.6 /100 | #146 | Excellent 19.7% |
Demographics Similar to Bulgarians by Female Poverty Among 18-24 Year Olds
In terms of female poverty among 18-24 year olds, the demographic groups most similar to Bulgarians are Macedonian (18.1%, a difference of 0.010%), Nicaraguan (18.1%, a difference of 0.090%), Spanish American Indian (18.1%, a difference of 0.18%), Immigrants from Argentina (18.0%, a difference of 0.47%), and Immigrants from Southern Europe (18.2%, a difference of 0.47%).
| Demographics | Rating | Rank | Female Poverty Among 18-24 Year Olds |
| Immigrants | Greece | 100.0 /100 | #35 | Exceptional 17.9% |
| Immigrants | South America | 100.0 /100 | #36 | Exceptional 17.9% |
| Immigrants | Croatia | 100.0 /100 | #37 | Exceptional 17.9% |
| South Americans | 100.0 /100 | #38 | Exceptional 18.0% |
| Puget Sound Salish | 100.0 /100 | #39 | Exceptional 18.0% |
| Immigrants | Romania | 100.0 /100 | #40 | Exceptional 18.0% |
| Immigrants | Argentina | 100.0 /100 | #41 | Exceptional 18.0% |
| Bulgarians | 100.0 /100 | #42 | Exceptional 18.1% |
| Macedonians | 100.0 /100 | #43 | Exceptional 18.1% |
| Nicaraguans | 100.0 /100 | #44 | Exceptional 18.1% |
| Spanish American Indians | 100.0 /100 | #45 | Exceptional 18.1% |
| Immigrants | Southern Europe | 100.0 /100 | #46 | Exceptional 18.2% |
| Asians | 100.0 /100 | #47 | Exceptional 18.2% |
| Sri Lankans | 100.0 /100 | #48 | Exceptional 18.2% |
| Bhutanese | 100.0 /100 | #49 | Exceptional 18.2% |