Indian (Asian) vs Colombian Female Poverty Among 18-24 Year Olds
COMPARE
Indian (Asian)
Colombian
Female Poverty Among 18-24 Year Olds
Female Poverty Among 18-24 Year Olds Comparison
Indians (Asian)
Colombians
19.6%
FEMALE POVERTY AMONG 18-24 YEAR OLDS
88.3/ 100
METRIC RATING
139th/ 347
METRIC RANK
17.7%
FEMALE POVERTY AMONG 18-24 YEAR OLDS
100.0/ 100
METRIC RATING
27th/ 347
METRIC RANK
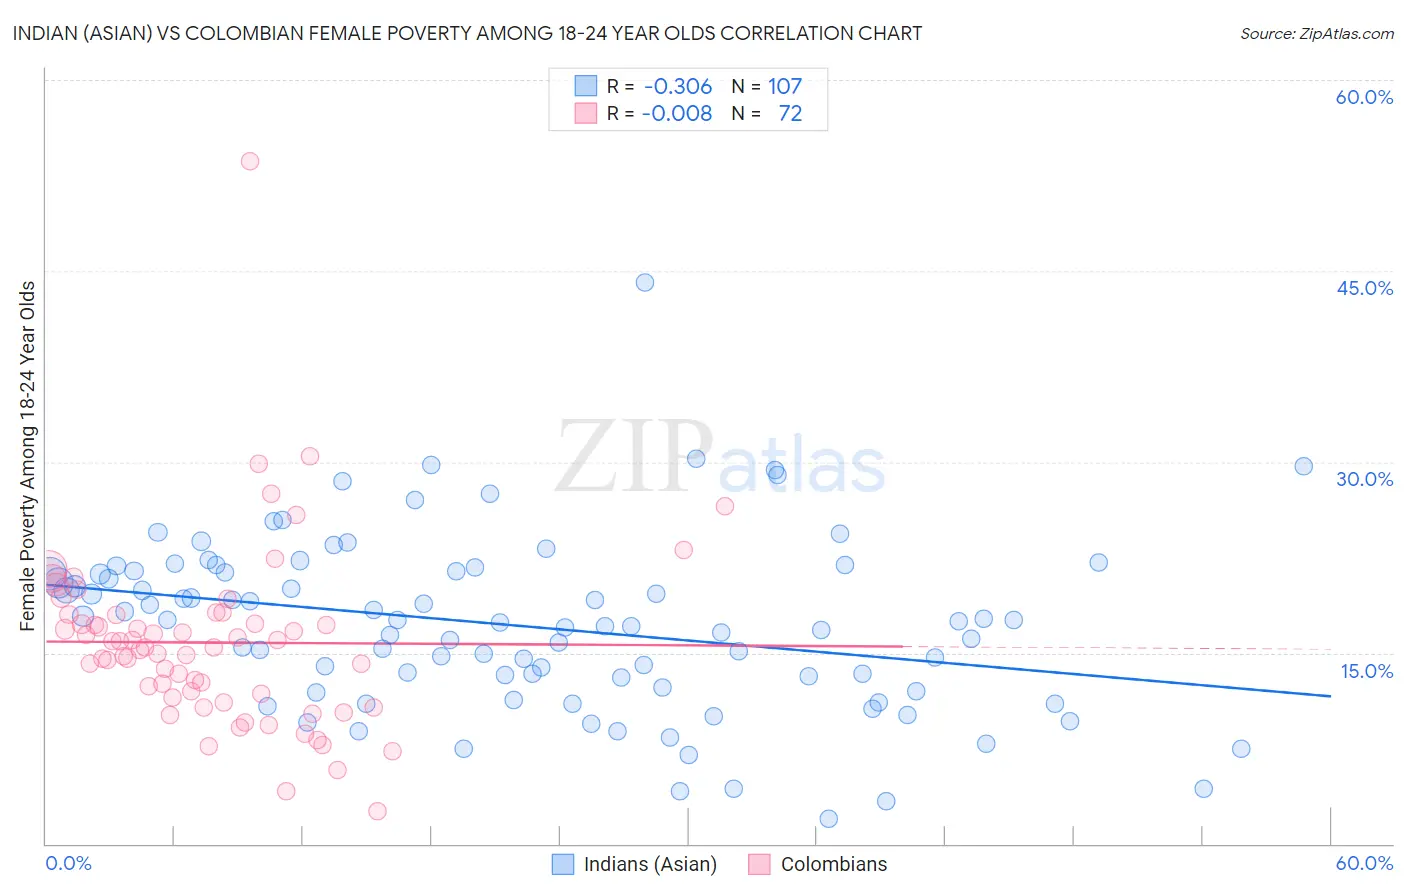
Indian (Asian) vs Colombian Female Poverty Among 18-24 Year Olds Correlation Chart
The statistical analysis conducted on geographies consisting of 476,846,332 people shows a mild negative correlation between the proportion of Indians (Asian) and poverty level among females between the ages 18 and 24 in the United States with a correlation coefficient (R) of -0.306 and weighted average of 19.6%. Similarly, the statistical analysis conducted on geographies consisting of 408,743,198 people shows no correlation between the proportion of Colombians and poverty level among females between the ages 18 and 24 in the United States with a correlation coefficient (R) of -0.008 and weighted average of 17.7%, a difference of 10.9%.
Female Poverty Among 18-24 Year Olds Correlation Summary
| Measurement | Indian (Asian) | Colombian |
| Minimum | 2.0% | 2.5% |
| Maximum | 44.1% | 53.6% |
| Range | 42.1% | 51.0% |
| Mean | 17.1% | 15.8% |
| Median | 17.4% | 15.4% |
| Interquartile 25% (IQ1) | 12.3% | 11.6% |
| Interquartile 75% (IQ3) | 21.4% | 18.0% |
| Interquartile Range (IQR) | 9.1% | 6.4% |
| Standard Deviation (Sample) | 6.8% | 7.1% |
| Standard Deviation (Population) | 6.8% | 7.1% |
Similar Demographics by Female Poverty Among 18-24 Year Olds
Demographics Similar to Indians (Asian) by Female Poverty Among 18-24 Year Olds
In terms of female poverty among 18-24 year olds, the demographic groups most similar to Indians (Asian) are Immigrants from Morocco (19.6%, a difference of 0.20%), Immigrants from Trinidad and Tobago (19.7%, a difference of 0.30%), Pennsylvania German (19.7%, a difference of 0.31%), Austrian (19.5%, a difference of 0.32%), and Panamanian (19.7%, a difference of 0.41%).
| Demographics | Rating | Rank | Female Poverty Among 18-24 Year Olds |
| Jamaicans | 92.1 /100 | #132 | Exceptional 19.5% |
| Turks | 92.1 /100 | #133 | Exceptional 19.5% |
| Immigrants | North America | 92.1 /100 | #134 | Exceptional 19.5% |
| Soviet Union | 92.0 /100 | #135 | Exceptional 19.5% |
| Russians | 91.5 /100 | #136 | Exceptional 19.5% |
| Austrians | 90.7 /100 | #137 | Exceptional 19.5% |
| Immigrants | Morocco | 89.9 /100 | #138 | Excellent 19.6% |
| Indians (Asian) | 88.3 /100 | #139 | Excellent 19.6% |
| Immigrants | Trinidad and Tobago | 85.6 /100 | #140 | Excellent 19.7% |
| Pennsylvania Germans | 85.5 /100 | #141 | Excellent 19.7% |
| Panamanians | 84.6 /100 | #142 | Excellent 19.7% |
| Slavs | 84.4 /100 | #143 | Excellent 19.7% |
| Immigrants | Northern Africa | 84.1 /100 | #144 | Excellent 19.7% |
| Canadians | 83.8 /100 | #145 | Excellent 19.7% |
| Immigrants | Bosnia and Herzegovina | 83.6 /100 | #146 | Excellent 19.7% |
Demographics Similar to Colombians by Female Poverty Among 18-24 Year Olds
In terms of female poverty among 18-24 year olds, the demographic groups most similar to Colombians are Immigrants from Fiji (17.7%, a difference of 0.11%), Venezuelan (17.7%, a difference of 0.14%), Immigrants from South Central Asia (17.6%, a difference of 0.43%), Portuguese (17.8%, a difference of 0.47%), and Maltese (17.6%, a difference of 0.61%).
| Demographics | Rating | Rank | Female Poverty Among 18-24 Year Olds |
| Immigrants | Venezuela | 100.0 /100 | #20 | Exceptional 17.4% |
| Bolivians | 100.0 /100 | #21 | Exceptional 17.4% |
| Immigrants | Hong Kong | 100.0 /100 | #22 | Exceptional 17.5% |
| Immigrants | North Macedonia | 100.0 /100 | #23 | Exceptional 17.6% |
| Maltese | 100.0 /100 | #24 | Exceptional 17.6% |
| Immigrants | South Central Asia | 100.0 /100 | #25 | Exceptional 17.6% |
| Immigrants | Fiji | 100.0 /100 | #26 | Exceptional 17.7% |
| Colombians | 100.0 /100 | #27 | Exceptional 17.7% |
| Venezuelans | 100.0 /100 | #28 | Exceptional 17.7% |
| Portuguese | 100.0 /100 | #29 | Exceptional 17.8% |
| Immigrants | South Eastern Asia | 100.0 /100 | #30 | Exceptional 17.8% |
| Immigrants | Vietnam | 100.0 /100 | #31 | Exceptional 17.8% |
| Immigrants | Moldova | 100.0 /100 | #32 | Exceptional 17.9% |
| Native Hawaiians | 100.0 /100 | #33 | Exceptional 17.9% |
| Immigrants | Nicaragua | 100.0 /100 | #34 | Exceptional 17.9% |