Immigrants vs Immigrants from Portugal Female Poverty
COMPARE
Immigrants
Immigrants from Portugal
Female Poverty
Female Poverty Comparison
Immigrants
Immigrants from Portugal
14.4%
FEMALE POVERTY
4.5/ 100
METRIC RATING
217th/ 347
METRIC RANK
13.6%
FEMALE POVERTY
41.5/ 100
METRIC RATING
186th/ 347
METRIC RANK
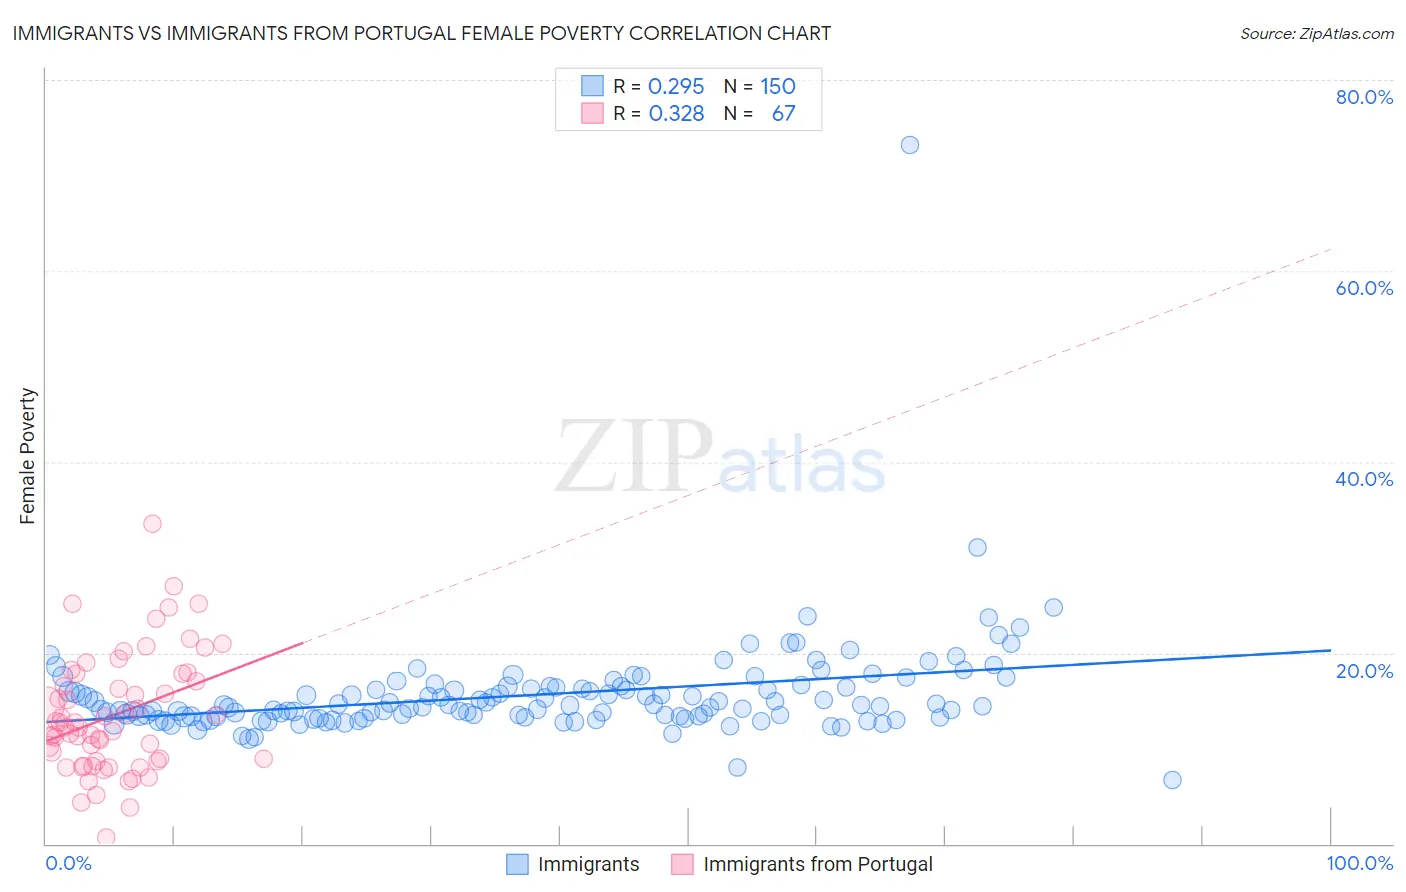
Immigrants vs Immigrants from Portugal Female Poverty Correlation Chart
The statistical analysis conducted on geographies consisting of 576,347,863 people shows a weak positive correlation between the proportion of Immigrants and poverty level among females in the United States with a correlation coefficient (R) of 0.295 and weighted average of 14.4%. Similarly, the statistical analysis conducted on geographies consisting of 174,717,280 people shows a mild positive correlation between the proportion of Immigrants from Portugal and poverty level among females in the United States with a correlation coefficient (R) of 0.328 and weighted average of 13.6%, a difference of 6.5%.
Female Poverty Correlation Summary
| Measurement | Immigrants | Immigrants from Portugal |
| Minimum | 6.7% | 0.65% |
| Maximum | 73.1% | 33.6% |
| Range | 66.5% | 32.9% |
| Mean | 15.6% | 13.5% |
| Median | 14.4% | 12.2% |
| Interquartile 25% (IQ1) | 13.3% | 8.6% |
| Interquartile 75% (IQ3) | 16.4% | 17.8% |
| Interquartile Range (IQR) | 3.1% | 9.1% |
| Standard Deviation (Sample) | 5.6% | 6.2% |
| Standard Deviation (Population) | 5.6% | 6.1% |
Similar Demographics by Female Poverty
Demographics Similar to Immigrants by Female Poverty
In terms of female poverty, the demographic groups most similar to Immigrants are Immigrants from Thailand (14.4%, a difference of 0.030%), Immigrants from Uzbekistan (14.4%, a difference of 0.050%), Immigrants from Panama (14.4%, a difference of 0.12%), Japanese (14.5%, a difference of 0.19%), and Alsatian (14.5%, a difference of 0.23%).
| Demographics | Rating | Rank | Female Poverty |
| Malaysians | 7.4 /100 | #210 | Tragic 14.3% |
| Moroccans | 7.2 /100 | #211 | Tragic 14.3% |
| Bermudans | 5.5 /100 | #212 | Tragic 14.4% |
| Alaskan Athabascans | 5.3 /100 | #213 | Tragic 14.4% |
| Marshallese | 5.0 /100 | #214 | Tragic 14.4% |
| Immigrants | Panama | 4.7 /100 | #215 | Tragic 14.4% |
| Immigrants | Thailand | 4.5 /100 | #216 | Tragic 14.4% |
| Immigrants | Immigrants | 4.5 /100 | #217 | Tragic 14.4% |
| Immigrants | Uzbekistan | 4.4 /100 | #218 | Tragic 14.4% |
| Japanese | 4.1 /100 | #219 | Tragic 14.5% |
| Alsatians | 4.0 /100 | #220 | Tragic 14.5% |
| Immigrants | Cambodia | 3.7 /100 | #221 | Tragic 14.5% |
| Immigrants | Nonimmigrants | 3.7 /100 | #222 | Tragic 14.5% |
| Immigrants | Africa | 3.3 /100 | #223 | Tragic 14.5% |
| Americans | 2.8 /100 | #224 | Tragic 14.6% |
Demographics Similar to Immigrants from Portugal by Female Poverty
In terms of female poverty, the demographic groups most similar to Immigrants from Portugal are Immigrants from Venezuela (13.6%, a difference of 0.050%), Immigrants from Cameroon (13.5%, a difference of 0.060%), Hawaiian (13.6%, a difference of 0.16%), Immigrants from Sierra Leone (13.5%, a difference of 0.17%), and Uruguayan (13.6%, a difference of 0.17%).
| Demographics | Rating | Rank | Female Poverty |
| Immigrants | Syria | 48.8 /100 | #179 | Average 13.5% |
| South Americans | 44.8 /100 | #180 | Average 13.5% |
| Venezuelans | 44.5 /100 | #181 | Average 13.5% |
| Immigrants | Colombia | 44.5 /100 | #182 | Average 13.5% |
| Kenyans | 43.8 /100 | #183 | Average 13.5% |
| Immigrants | Sierra Leone | 43.2 /100 | #184 | Average 13.5% |
| Immigrants | Cameroon | 42.0 /100 | #185 | Average 13.5% |
| Immigrants | Portugal | 41.5 /100 | #186 | Average 13.6% |
| Immigrants | Venezuela | 41.0 /100 | #187 | Average 13.6% |
| Hawaiians | 39.9 /100 | #188 | Fair 13.6% |
| Uruguayans | 39.8 /100 | #189 | Fair 13.6% |
| Sierra Leoneans | 33.1 /100 | #190 | Fair 13.7% |
| Immigrants | Kuwait | 32.7 /100 | #191 | Fair 13.7% |
| Immigrants | Costa Rica | 31.9 /100 | #192 | Fair 13.7% |
| Iraqis | 31.8 /100 | #193 | Fair 13.7% |