Immigrants vs Immigrants from Austria Unemployment Among Ages 20 to 24 years
COMPARE
Immigrants
Immigrants from Austria
Unemployment Among Ages 20 to 24 years
Unemployment Among Ages 20 to 24 years Comparison
Immigrants
Immigrants from Austria
10.6%
UNEMPLOYMENT AMONG AGES 20 TO 24 YEARS
2.7/ 100
METRIC RATING
237th/ 347
METRIC RANK
10.2%
UNEMPLOYMENT AMONG AGES 20 TO 24 YEARS
81.4/ 100
METRIC RATING
140th/ 347
METRIC RANK
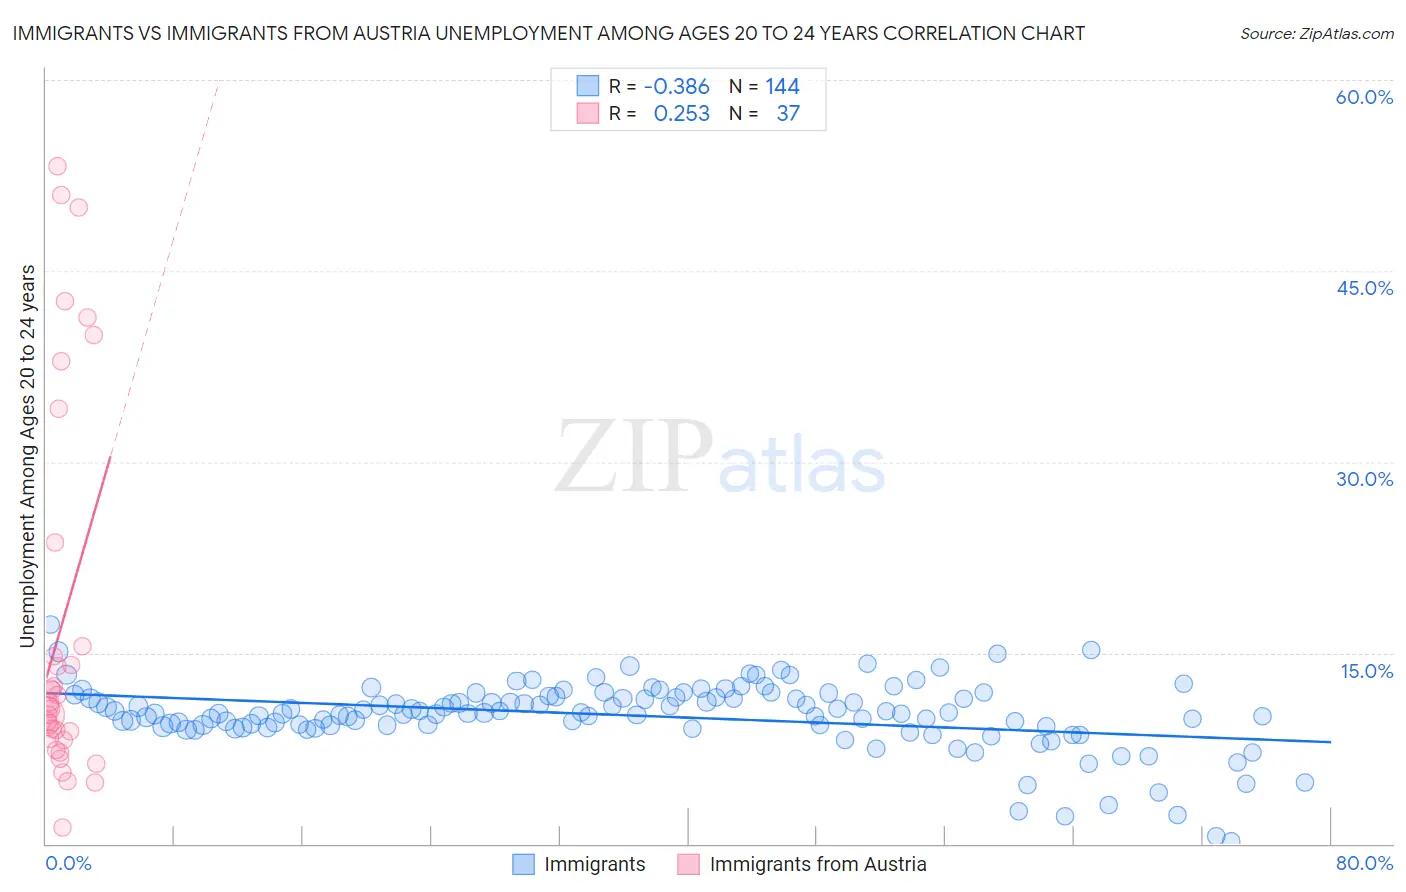
Immigrants vs Immigrants from Austria Unemployment Among Ages 20 to 24 years Correlation Chart
The statistical analysis conducted on geographies consisting of 528,492,855 people shows a mild negative correlation between the proportion of Immigrants and unemployment rate among population between the ages 20 and 24 in the United States with a correlation coefficient (R) of -0.386 and weighted average of 10.6%. Similarly, the statistical analysis conducted on geographies consisting of 165,080,210 people shows a weak positive correlation between the proportion of Immigrants from Austria and unemployment rate among population between the ages 20 and 24 in the United States with a correlation coefficient (R) of 0.253 and weighted average of 10.2%, a difference of 4.7%.
Unemployment Among Ages 20 to 24 years Correlation Summary
| Measurement | Immigrants | Immigrants from Austria |
| Minimum | 0.20% | 1.2% |
| Maximum | 17.2% | 53.2% |
| Range | 17.0% | 52.0% |
| Mean | 10.1% | 17.3% |
| Median | 10.2% | 10.8% |
| Interquartile 25% (IQ1) | 9.3% | 8.2% |
| Interquartile 75% (IQ3) | 11.5% | 19.6% |
| Interquartile Range (IQR) | 2.3% | 11.3% |
| Standard Deviation (Sample) | 2.7% | 14.9% |
| Standard Deviation (Population) | 2.7% | 14.7% |
Similar Demographics by Unemployment Among Ages 20 to 24 years
Demographics Similar to Immigrants by Unemployment Among Ages 20 to 24 years
In terms of unemployment among ages 20 to 24 years, the demographic groups most similar to Immigrants are Immigrants from Pakistan (10.6%, a difference of 0.020%), Salvadoran (10.7%, a difference of 0.080%), Mexican (10.6%, a difference of 0.17%), Immigrants from Ukraine (10.6%, a difference of 0.21%), and Immigrants from Africa (10.6%, a difference of 0.26%).
| Demographics | Rating | Rank | Unemployment Among Ages 20 to 24 years |
| French American Indians | 4.1 /100 | #230 | Tragic 10.6% |
| Native Hawaiians | 3.9 /100 | #231 | Tragic 10.6% |
| Israelis | 3.7 /100 | #232 | Tragic 10.6% |
| Choctaw | 3.6 /100 | #233 | Tragic 10.6% |
| Immigrants | Africa | 3.5 /100 | #234 | Tragic 10.6% |
| Immigrants | Ukraine | 3.3 /100 | #235 | Tragic 10.6% |
| Mexicans | 3.2 /100 | #236 | Tragic 10.6% |
| Immigrants | Immigrants | 2.7 /100 | #237 | Tragic 10.6% |
| Immigrants | Pakistan | 2.6 /100 | #238 | Tragic 10.6% |
| Salvadorans | 2.4 /100 | #239 | Tragic 10.7% |
| Immigrants | Central America | 2.0 /100 | #240 | Tragic 10.7% |
| Immigrants | El Salvador | 1.7 /100 | #241 | Tragic 10.7% |
| Moroccans | 1.4 /100 | #242 | Tragic 10.7% |
| Immigrants | Belarus | 1.3 /100 | #243 | Tragic 10.7% |
| Immigrants | Mexico | 1.2 /100 | #244 | Tragic 10.7% |
Demographics Similar to Immigrants from Austria by Unemployment Among Ages 20 to 24 years
In terms of unemployment among ages 20 to 24 years, the demographic groups most similar to Immigrants from Austria are Immigrants from the Azores (10.2%, a difference of 0.0%), Uruguayan (10.2%, a difference of 0.030%), Burmese (10.2%, a difference of 0.060%), Immigrants from Northern Africa (10.2%, a difference of 0.070%), and Immigrants from North America (10.2%, a difference of 0.070%).
| Demographics | Rating | Rank | Unemployment Among Ages 20 to 24 years |
| Austrians | 83.9 /100 | #133 | Excellent 10.2% |
| Romanians | 83.8 /100 | #134 | Excellent 10.2% |
| Comanche | 83.4 /100 | #135 | Excellent 10.2% |
| Immigrants | Northern Africa | 82.5 /100 | #136 | Excellent 10.2% |
| Immigrants | North America | 82.5 /100 | #137 | Excellent 10.2% |
| Burmese | 82.3 /100 | #138 | Excellent 10.2% |
| Uruguayans | 81.9 /100 | #139 | Excellent 10.2% |
| Immigrants | Austria | 81.4 /100 | #140 | Excellent 10.2% |
| Immigrants | Azores | 81.4 /100 | #141 | Excellent 10.2% |
| Slovaks | 80.2 /100 | #142 | Excellent 10.2% |
| Immigrants | Jordan | 79.0 /100 | #143 | Good 10.2% |
| Brazilians | 78.4 /100 | #144 | Good 10.2% |
| Argentineans | 78.0 /100 | #145 | Good 10.2% |
| Asians | 77.7 /100 | #146 | Good 10.2% |
| French Canadians | 77.5 /100 | #147 | Good 10.2% |