Immigrants vs Ghanaian Unemployment Among Ages 65 to 74 years
COMPARE
Immigrants
Ghanaian
Unemployment Among Ages 65 to 74 years
Unemployment Among Ages 65 to 74 years Comparison
Immigrants
Ghanaians
5.6%
UNEMPLOYMENT AMONG AGES 65 TO 74 YEARS
0.9/ 100
METRIC RATING
247th/ 347
METRIC RANK
5.6%
UNEMPLOYMENT AMONG AGES 65 TO 74 YEARS
1.4/ 100
METRIC RATING
240th/ 347
METRIC RANK
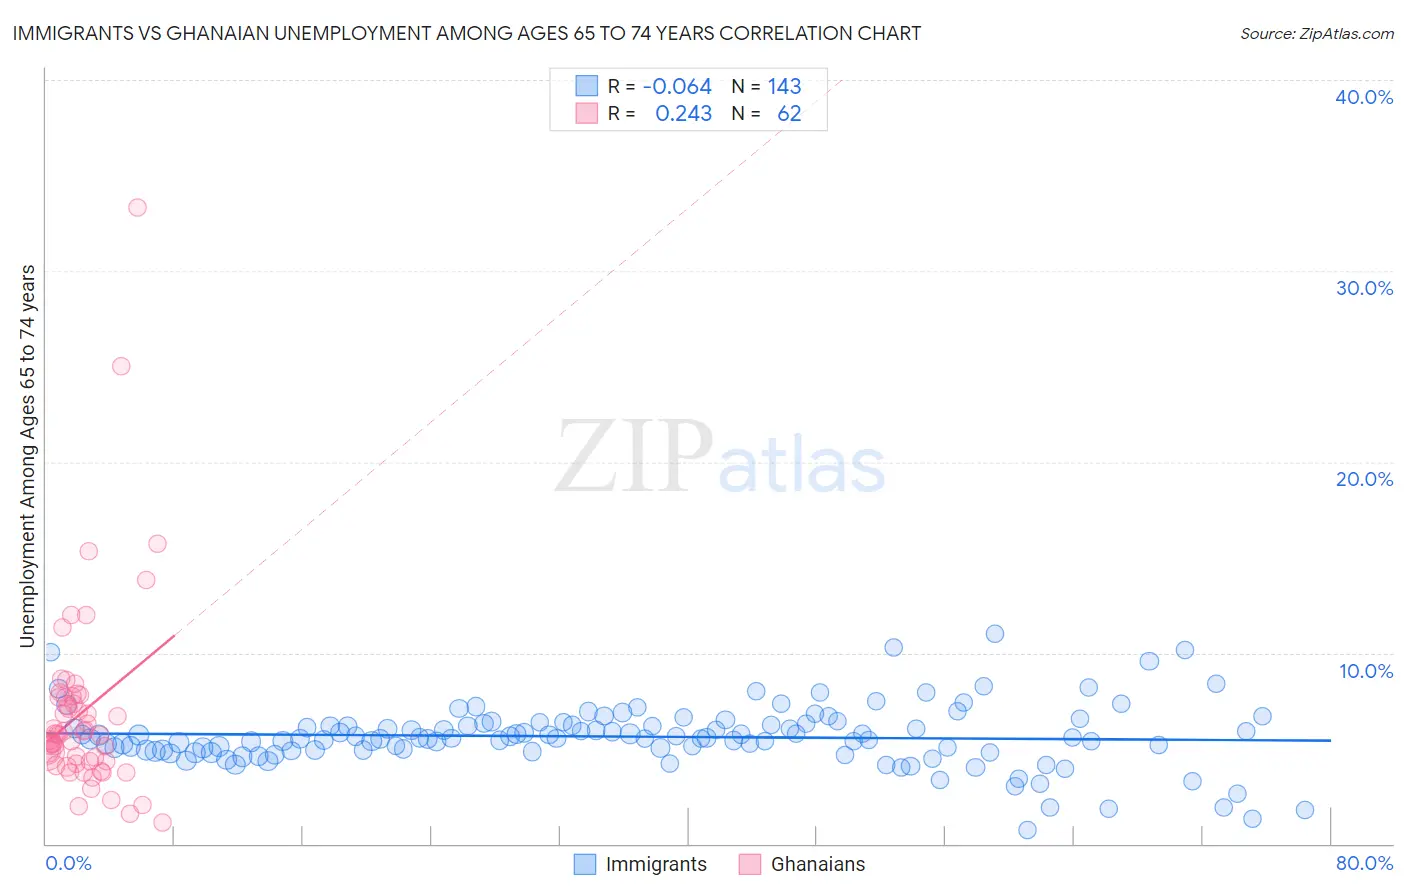
Immigrants vs Ghanaian Unemployment Among Ages 65 to 74 years Correlation Chart
The statistical analysis conducted on geographies consisting of 448,278,971 people shows a slight negative correlation between the proportion of Immigrants and unemployment rate among population between the ages 65 and 74 in the United States with a correlation coefficient (R) of -0.064 and weighted average of 5.6%. Similarly, the statistical analysis conducted on geographies consisting of 178,641,718 people shows a weak positive correlation between the proportion of Ghanaians and unemployment rate among population between the ages 65 and 74 in the United States with a correlation coefficient (R) of 0.243 and weighted average of 5.6%, a difference of 0.43%.
Unemployment Among Ages 65 to 74 years Correlation Summary
| Measurement | Immigrants | Ghanaian |
| Minimum | 0.70% | 1.1% |
| Maximum | 11.0% | 33.3% |
| Range | 10.3% | 32.2% |
| Mean | 5.6% | 6.9% |
| Median | 5.5% | 5.7% |
| Interquartile 25% (IQ1) | 4.9% | 4.3% |
| Interquartile 75% (IQ3) | 6.3% | 7.7% |
| Interquartile Range (IQR) | 1.4% | 3.4% |
| Standard Deviation (Sample) | 1.6% | 5.1% |
| Standard Deviation (Population) | 1.6% | 5.1% |
Demographics Similar to Immigrants and Ghanaians by Unemployment Among Ages 65 to 74 years
In terms of unemployment among ages 65 to 74 years, the demographic groups most similar to Immigrants are Immigrants from Argentina (5.6%, a difference of 0.0%), Paraguayan (5.6%, a difference of 0.050%), Immigrants from Micronesia (5.6%, a difference of 0.060%), Immigrants from Greece (5.6%, a difference of 0.060%), and Trinidadian and Tobagonian (5.6%, a difference of 0.060%). Similarly, the demographic groups most similar to Ghanaians are Cree (5.6%, a difference of 0.030%), Immigrants from Ghana (5.6%, a difference of 0.040%), Immigrants from Peru (5.6%, a difference of 0.090%), German Russian (5.5%, a difference of 0.10%), and Cajun (5.5%, a difference of 0.17%).
| Demographics | Rating | Rank | Unemployment Among Ages 65 to 74 years |
| South American Indians | 2.3 /100 | #233 | Tragic 5.5% |
| French American Indians | 2.2 /100 | #234 | Tragic 5.5% |
| Peruvians | 2.2 /100 | #235 | Tragic 5.5% |
| Hopi | 2.2 /100 | #236 | Tragic 5.5% |
| Immigrants | Belize | 2.2 /100 | #237 | Tragic 5.5% |
| Cajuns | 1.8 /100 | #238 | Tragic 5.5% |
| German Russians | 1.6 /100 | #239 | Tragic 5.5% |
| Ghanaians | 1.4 /100 | #240 | Tragic 5.6% |
| Cree | 1.4 /100 | #241 | Tragic 5.6% |
| Immigrants | Ghana | 1.4 /100 | #242 | Tragic 5.6% |
| Immigrants | Peru | 1.3 /100 | #243 | Tragic 5.6% |
| Immigrants | Micronesia | 0.9 /100 | #244 | Tragic 5.6% |
| Immigrants | Greece | 0.9 /100 | #245 | Tragic 5.6% |
| Paraguayans | 0.9 /100 | #246 | Tragic 5.6% |
| Immigrants | Immigrants | 0.9 /100 | #247 | Tragic 5.6% |
| Immigrants | Argentina | 0.9 /100 | #248 | Tragic 5.6% |
| Trinidadians and Tobagonians | 0.8 /100 | #249 | Tragic 5.6% |
| Cape Verdeans | 0.7 /100 | #250 | Tragic 5.6% |
| Brazilians | 0.5 /100 | #251 | Tragic 5.6% |
| Colombians | 0.5 /100 | #252 | Tragic 5.6% |
| Immigrants | Brazil | 0.5 /100 | #253 | Tragic 5.6% |