Immigrants from Zimbabwe vs Immigrants from Switzerland Child Poverty Under the Age of 16
COMPARE
Immigrants from Zimbabwe
Immigrants from Switzerland
Child Poverty Under the Age of 16
Child Poverty Under the Age of 16 Comparison
Immigrants from Zimbabwe
Immigrants from Switzerland
15.0%
CHILD POVERTY UNDER THE AGE OF 16
92.1/ 100
METRIC RATING
121st/ 347
METRIC RANK
14.8%
CHILD POVERTY UNDER THE AGE OF 16
95.1/ 100
METRIC RATING
101st/ 347
METRIC RANK
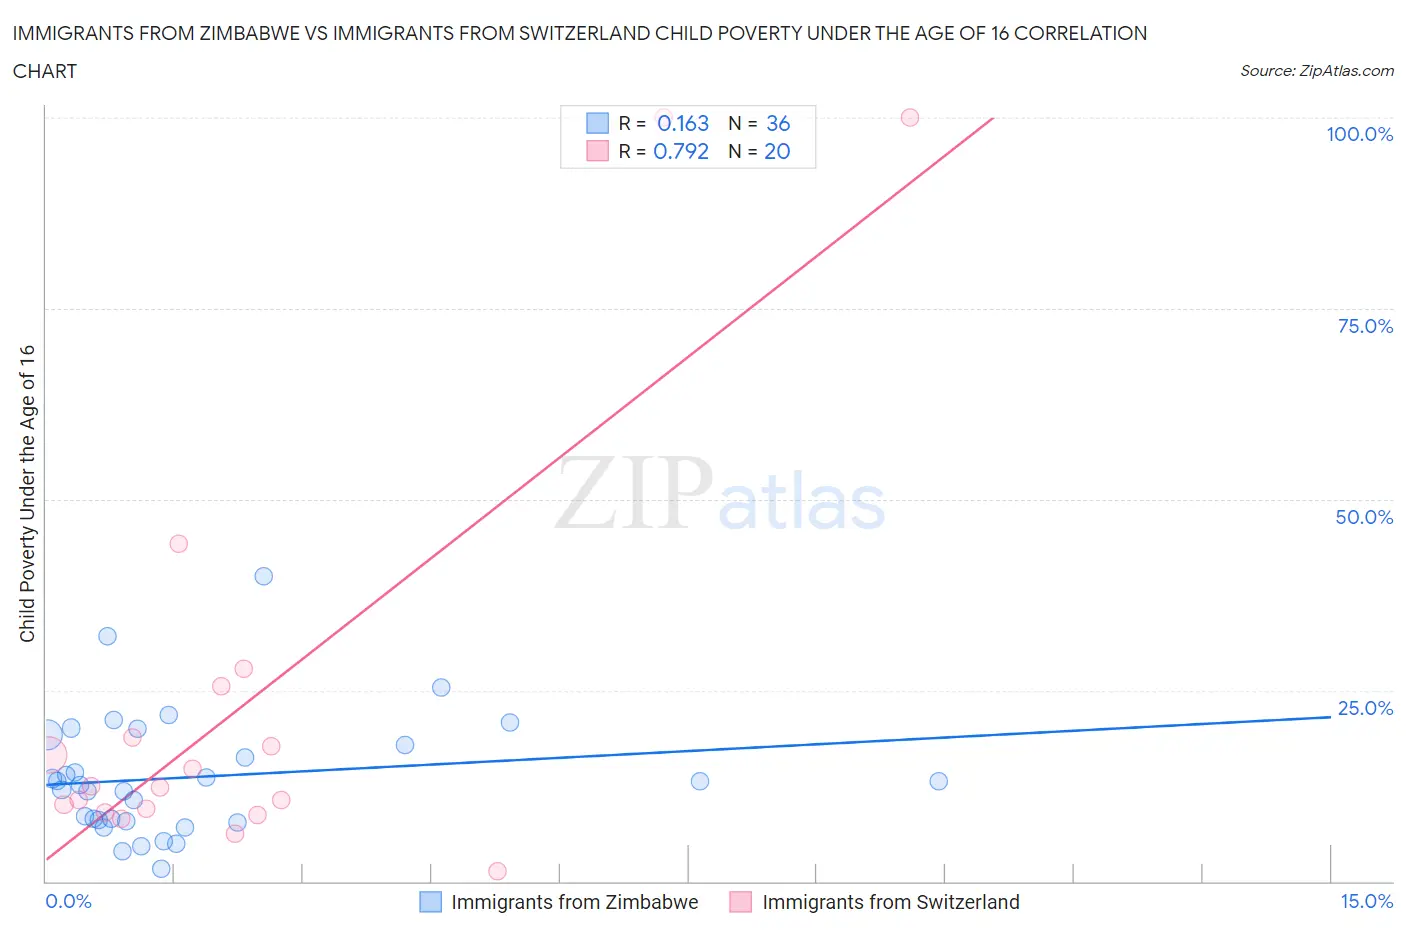
Immigrants from Zimbabwe vs Immigrants from Switzerland Child Poverty Under the Age of 16 Correlation Chart
The statistical analysis conducted on geographies consisting of 117,606,352 people shows a poor positive correlation between the proportion of Immigrants from Zimbabwe and poverty level among children under the age of 16 in the United States with a correlation coefficient (R) of 0.163 and weighted average of 15.0%. Similarly, the statistical analysis conducted on geographies consisting of 147,239,417 people shows a strong positive correlation between the proportion of Immigrants from Switzerland and poverty level among children under the age of 16 in the United States with a correlation coefficient (R) of 0.792 and weighted average of 14.8%, a difference of 1.6%.
Child Poverty Under the Age of 16 Correlation Summary
| Measurement | Immigrants from Zimbabwe | Immigrants from Switzerland |
| Minimum | 1.7% | 1.3% |
| Maximum | 40.0% | 100.0% |
| Range | 38.3% | 98.7% |
| Mean | 13.6% | 23.2% |
| Median | 12.9% | 12.4% |
| Interquartile 25% (IQ1) | 8.0% | 9.3% |
| Interquartile 75% (IQ3) | 18.5% | 22.1% |
| Interquartile Range (IQR) | 10.5% | 12.9% |
| Standard Deviation (Sample) | 8.0% | 27.9% |
| Standard Deviation (Population) | 7.9% | 27.2% |
Demographics Similar to Immigrants from Zimbabwe and Immigrants from Switzerland by Child Poverty Under the Age of 16
In terms of child poverty under the age of 16, the demographic groups most similar to Immigrants from Zimbabwe are South African (15.0%, a difference of 0.010%), Scottish (15.0%, a difference of 0.090%), Immigrants from Malaysia (15.0%, a difference of 0.25%), Immigrants from Norway (15.0%, a difference of 0.30%), and Carpatho Rusyn (14.9%, a difference of 0.45%). Similarly, the demographic groups most similar to Immigrants from Switzerland are Romanian (14.8%, a difference of 0.070%), Immigrants from Egypt (14.8%, a difference of 0.11%), Immigrants from England (14.8%, a difference of 0.16%), Basque (14.8%, a difference of 0.27%), and Serbian (14.8%, a difference of 0.40%).
| Demographics | Rating | Rank | Child Poverty Under the Age of 16 |
| Immigrants | Switzerland | 95.1 /100 | #101 | Exceptional 14.8% |
| Romanians | 95.0 /100 | #102 | Exceptional 14.8% |
| Immigrants | Egypt | 94.9 /100 | #103 | Exceptional 14.8% |
| Immigrants | England | 94.8 /100 | #104 | Exceptional 14.8% |
| Basques | 94.7 /100 | #105 | Exceptional 14.8% |
| Serbians | 94.5 /100 | #106 | Exceptional 14.8% |
| Chileans | 94.4 /100 | #107 | Exceptional 14.8% |
| Jordanians | 94.2 /100 | #108 | Exceptional 14.8% |
| Tlingit-Haida | 94.1 /100 | #109 | Exceptional 14.9% |
| English | 93.5 /100 | #110 | Exceptional 14.9% |
| Immigrants | Denmark | 93.5 /100 | #111 | Exceptional 14.9% |
| Irish | 93.4 /100 | #112 | Exceptional 14.9% |
| Belgians | 93.3 /100 | #113 | Exceptional 14.9% |
| Sri Lankans | 93.2 /100 | #114 | Exceptional 14.9% |
| Immigrants | Ukraine | 93.1 /100 | #115 | Exceptional 14.9% |
| Carpatho Rusyns | 93.1 /100 | #116 | Exceptional 14.9% |
| Immigrants | Norway | 92.8 /100 | #117 | Exceptional 15.0% |
| Immigrants | Malaysia | 92.6 /100 | #118 | Exceptional 15.0% |
| Scottish | 92.3 /100 | #119 | Exceptional 15.0% |
| South Africans | 92.1 /100 | #120 | Exceptional 15.0% |
| Immigrants | Zimbabwe | 92.1 /100 | #121 | Exceptional 15.0% |