Immigrants from Zaire vs Osage 9th Grade
COMPARE
Immigrants from Zaire
Osage
9th Grade
9th Grade Comparison
Immigrants from Zaire
Osage
94.6%
9TH GRADE
20.6/ 100
METRIC RATING
200th/ 347
METRIC RANK
95.5%
9TH GRADE
96.8/ 100
METRIC RATING
109th/ 347
METRIC RANK
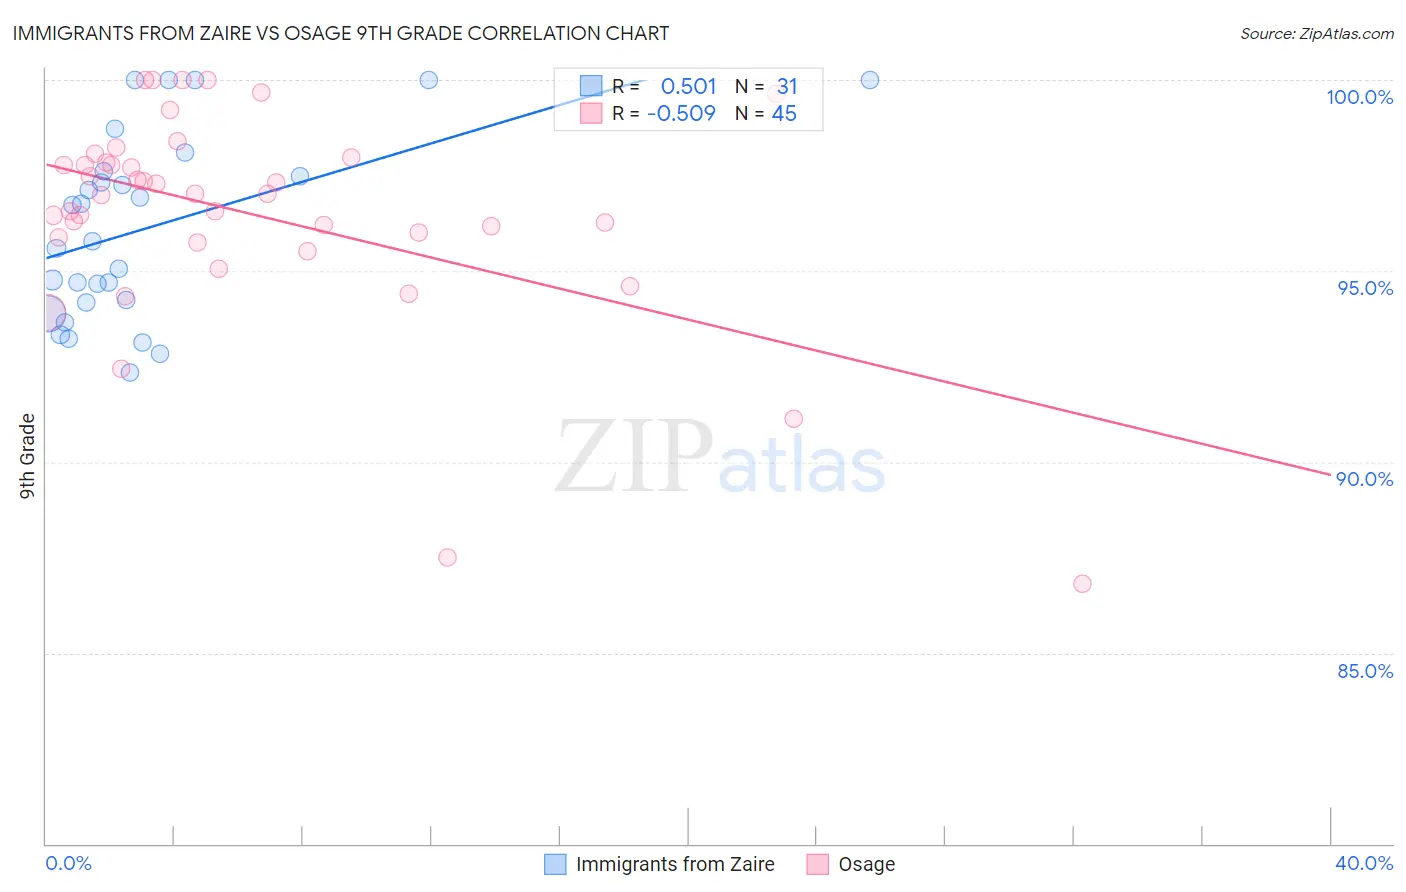
Immigrants from Zaire vs Osage 9th Grade Correlation Chart
The statistical analysis conducted on geographies consisting of 107,212,695 people shows a substantial positive correlation between the proportion of Immigrants from Zaire and percentage of population with at least 9th grade education in the United States with a correlation coefficient (R) of 0.501 and weighted average of 94.6%. Similarly, the statistical analysis conducted on geographies consisting of 91,808,929 people shows a substantial negative correlation between the proportion of Osage and percentage of population with at least 9th grade education in the United States with a correlation coefficient (R) of -0.509 and weighted average of 95.5%, a difference of 0.88%.
9th Grade Correlation Summary
| Measurement | Immigrants from Zaire | Osage |
| Minimum | 92.3% | 86.8% |
| Maximum | 100.0% | 100.0% |
| Range | 7.7% | 13.2% |
| Mean | 96.1% | 96.5% |
| Median | 95.8% | 97.0% |
| Interquartile 25% (IQ1) | 94.2% | 95.8% |
| Interquartile 75% (IQ3) | 97.6% | 97.9% |
| Interquartile Range (IQR) | 3.4% | 2.1% |
| Standard Deviation (Sample) | 2.4% | 2.8% |
| Standard Deviation (Population) | 2.4% | 2.8% |
Similar Demographics by 9th Grade
Demographics Similar to Immigrants from Zaire by 9th Grade
In terms of 9th grade, the demographic groups most similar to Immigrants from Zaire are Laotian (94.6%, a difference of 0.0%), Black/African American (94.6%, a difference of 0.0%), Immigrants from Eastern Asia (94.6%, a difference of 0.010%), Immigrants from Bahamas (94.6%, a difference of 0.010%), and Moroccan (94.6%, a difference of 0.010%).
| Demographics | Rating | Rank | 9th Grade |
| Paraguayans | 30.1 /100 | #193 | Fair 94.7% |
| Panamanians | 29.0 /100 | #194 | Fair 94.7% |
| Marshallese | 27.9 /100 | #195 | Fair 94.7% |
| Immigrants | Lebanon | 27.2 /100 | #196 | Fair 94.7% |
| Immigrants | Micronesia | 24.7 /100 | #197 | Fair 94.7% |
| Hawaiians | 22.7 /100 | #198 | Fair 94.7% |
| Laotians | 21.0 /100 | #199 | Fair 94.6% |
| Immigrants | Zaire | 20.6 /100 | #200 | Fair 94.6% |
| Blacks/African Americans | 20.5 /100 | #201 | Fair 94.6% |
| Immigrants | Eastern Asia | 19.8 /100 | #202 | Poor 94.6% |
| Immigrants | Bahamas | 19.8 /100 | #203 | Poor 94.6% |
| Moroccans | 19.6 /100 | #204 | Poor 94.6% |
| Immigrants | Sudan | 17.6 /100 | #205 | Poor 94.6% |
| Samoans | 17.3 /100 | #206 | Poor 94.6% |
| Immigrants | Morocco | 16.3 /100 | #207 | Poor 94.6% |
Demographics Similar to Osage by 9th Grade
In terms of 9th grade, the demographic groups most similar to Osage are Chickasaw (95.5%, a difference of 0.0%), Immigrants from Bulgaria (95.5%, a difference of 0.0%), Immigrants from Zimbabwe (95.5%, a difference of 0.010%), Immigrants from Norway (95.5%, a difference of 0.020%), and Cherokee (95.4%, a difference of 0.030%).
| Demographics | Rating | Rank | 9th Grade |
| Immigrants | Switzerland | 97.7 /100 | #102 | Exceptional 95.5% |
| Potawatomi | 97.7 /100 | #103 | Exceptional 95.5% |
| Syrians | 97.4 /100 | #104 | Exceptional 95.5% |
| Immigrants | France | 97.4 /100 | #105 | Exceptional 95.5% |
| Immigrants | Norway | 97.1 /100 | #106 | Exceptional 95.5% |
| Immigrants | Zimbabwe | 96.9 /100 | #107 | Exceptional 95.5% |
| Chickasaw | 96.8 /100 | #108 | Exceptional 95.5% |
| Osage | 96.8 /100 | #109 | Exceptional 95.5% |
| Immigrants | Bulgaria | 96.7 /100 | #110 | Exceptional 95.5% |
| Cherokee | 96.3 /100 | #111 | Exceptional 95.4% |
| Immigrants | Croatia | 96.2 /100 | #112 | Exceptional 95.4% |
| Iroquois | 96.2 /100 | #113 | Exceptional 95.4% |
| German Russians | 96.1 /100 | #114 | Exceptional 95.4% |
| Burmese | 96.0 /100 | #115 | Exceptional 95.4% |
| Immigrants | Europe | 95.7 /100 | #116 | Exceptional 95.4% |