Immigrants from Zaire vs Immigrants from Egypt Poverty
COMPARE
Immigrants from Zaire
Immigrants from Egypt
Poverty
Poverty Comparison
Immigrants from Zaire
Immigrants from Egypt
15.1%
POVERTY
0.0/ 100
METRIC RATING
293rd/ 347
METRIC RANK
11.5%
POVERTY
94.6/ 100
METRIC RATING
97th/ 347
METRIC RANK
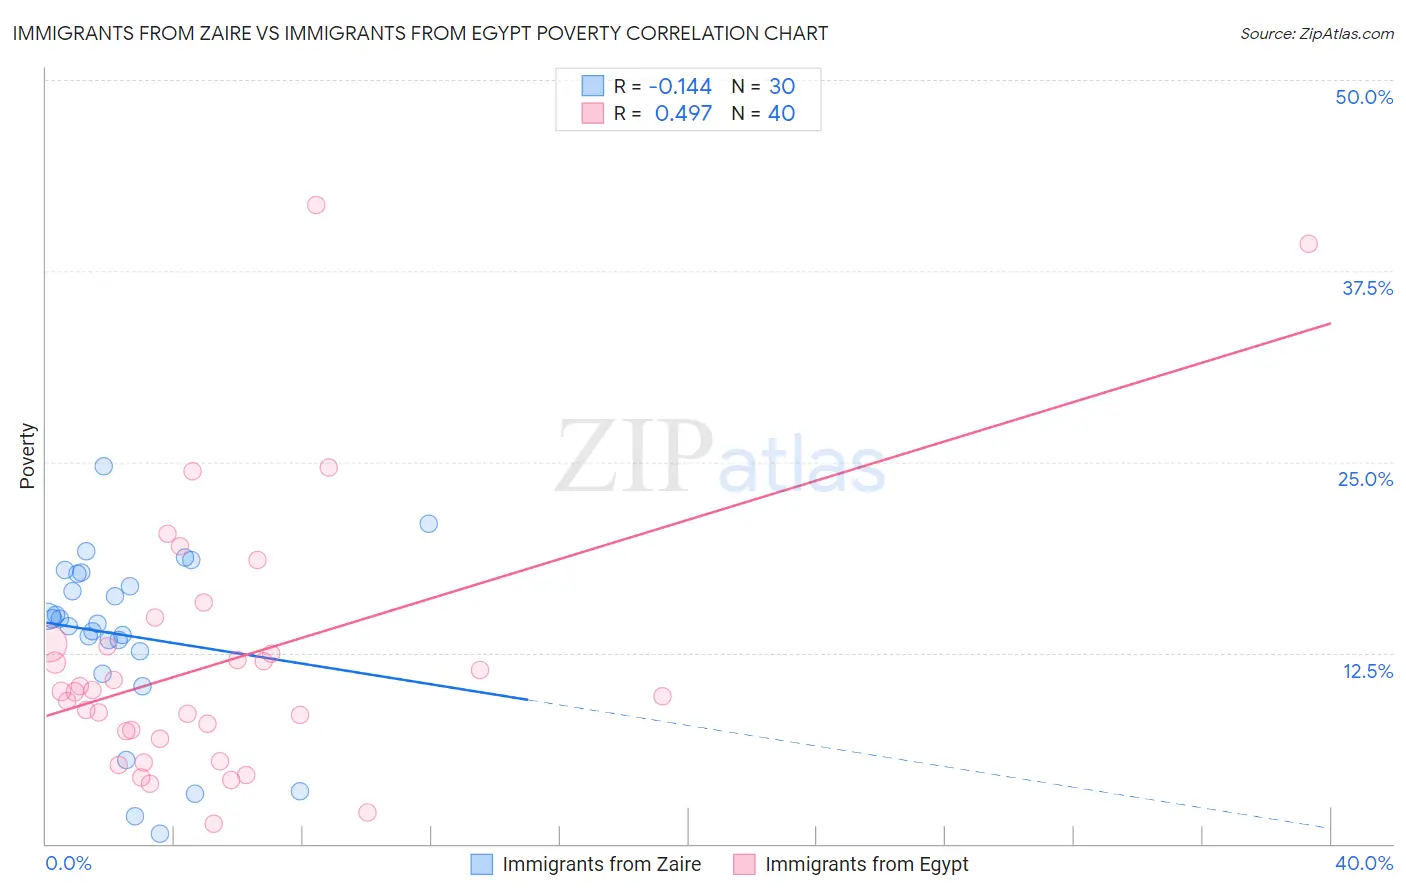
Immigrants from Zaire vs Immigrants from Egypt Poverty Correlation Chart
The statistical analysis conducted on geographies consisting of 107,241,785 people shows a poor negative correlation between the proportion of Immigrants from Zaire and poverty level in the United States with a correlation coefficient (R) of -0.144 and weighted average of 15.1%. Similarly, the statistical analysis conducted on geographies consisting of 245,409,377 people shows a moderate positive correlation between the proportion of Immigrants from Egypt and poverty level in the United States with a correlation coefficient (R) of 0.497 and weighted average of 11.5%, a difference of 32.0%.
Poverty Correlation Summary
| Measurement | Immigrants from Zaire | Immigrants from Egypt |
| Minimum | 0.62% | 1.3% |
| Maximum | 24.7% | 41.8% |
| Range | 24.1% | 40.5% |
| Mean | 13.7% | 11.9% |
| Median | 14.6% | 9.9% |
| Interquartile 25% (IQ1) | 12.6% | 7.1% |
| Interquartile 75% (IQ3) | 17.7% | 13.0% |
| Interquartile Range (IQR) | 5.1% | 5.9% |
| Standard Deviation (Sample) | 5.7% | 8.6% |
| Standard Deviation (Population) | 5.6% | 8.5% |
Similar Demographics by Poverty
Demographics Similar to Immigrants from Zaire by Poverty
In terms of poverty, the demographic groups most similar to Immigrants from Zaire are Indonesian (15.1%, a difference of 0.010%), Immigrants from Cabo Verde (15.1%, a difference of 0.060%), Mexican (15.1%, a difference of 0.18%), Immigrants from Belize (15.1%, a difference of 0.29%), and Yaqui (15.1%, a difference of 0.40%).
| Demographics | Rating | Rank | Poverty |
| Immigrants | Latin America | 0.0 /100 | #286 | Tragic 15.0% |
| Inupiat | 0.0 /100 | #287 | Tragic 15.1% |
| Yaqui | 0.0 /100 | #288 | Tragic 15.1% |
| Immigrants | Belize | 0.0 /100 | #289 | Tragic 15.1% |
| Mexicans | 0.0 /100 | #290 | Tragic 15.1% |
| Immigrants | Cabo Verde | 0.0 /100 | #291 | Tragic 15.1% |
| Indonesians | 0.0 /100 | #292 | Tragic 15.1% |
| Immigrants | Zaire | 0.0 /100 | #293 | Tragic 15.1% |
| Blackfeet | 0.0 /100 | #294 | Tragic 15.2% |
| Guatemalans | 0.0 /100 | #295 | Tragic 15.3% |
| Hispanics or Latinos | 0.0 /100 | #296 | Tragic 15.3% |
| Immigrants | Bangladesh | 0.0 /100 | #297 | Tragic 15.3% |
| Immigrants | Senegal | 0.0 /100 | #298 | Tragic 15.3% |
| Senegalese | 0.0 /100 | #299 | Tragic 15.3% |
| Immigrants | Central America | 0.0 /100 | #300 | Tragic 15.4% |
Demographics Similar to Immigrants from Egypt by Poverty
In terms of poverty, the demographic groups most similar to Immigrants from Egypt are Immigrants from South Africa (11.5%, a difference of 0.030%), Immigrants from Latvia (11.5%, a difference of 0.030%), Australian (11.4%, a difference of 0.15%), Paraguayan (11.4%, a difference of 0.16%), and Immigrants from Indonesia (11.5%, a difference of 0.17%).
| Demographics | Rating | Rank | Poverty |
| Immigrants | Denmark | 95.5 /100 | #90 | Exceptional 11.4% |
| Finns | 95.2 /100 | #91 | Exceptional 11.4% |
| British | 95.0 /100 | #92 | Exceptional 11.4% |
| Romanians | 94.9 /100 | #93 | Exceptional 11.4% |
| Paraguayans | 94.9 /100 | #94 | Exceptional 11.4% |
| Australians | 94.9 /100 | #95 | Exceptional 11.4% |
| Immigrants | South Africa | 94.7 /100 | #96 | Exceptional 11.5% |
| Immigrants | Egypt | 94.6 /100 | #97 | Exceptional 11.5% |
| Immigrants | Latvia | 94.5 /100 | #98 | Exceptional 11.5% |
| Immigrants | Indonesia | 94.2 /100 | #99 | Exceptional 11.5% |
| Scottish | 94.0 /100 | #100 | Exceptional 11.5% |
| Slavs | 93.3 /100 | #101 | Exceptional 11.5% |
| Laotians | 92.4 /100 | #102 | Exceptional 11.6% |
| Okinawans | 92.4 /100 | #103 | Exceptional 11.6% |
| Native Hawaiians | 92.1 /100 | #104 | Exceptional 11.6% |