Immigrants from Western Europe vs Immigrants from North Macedonia Poverty
COMPARE
Immigrants from Western Europe
Immigrants from North Macedonia
Poverty
Poverty Comparison
Immigrants from Western Europe
Immigrants from North Macedonia
11.8%
POVERTY
85.2/ 100
METRIC RATING
133rd/ 347
METRIC RANK
10.6%
POVERTY
99.7/ 100
METRIC RATING
20th/ 347
METRIC RANK
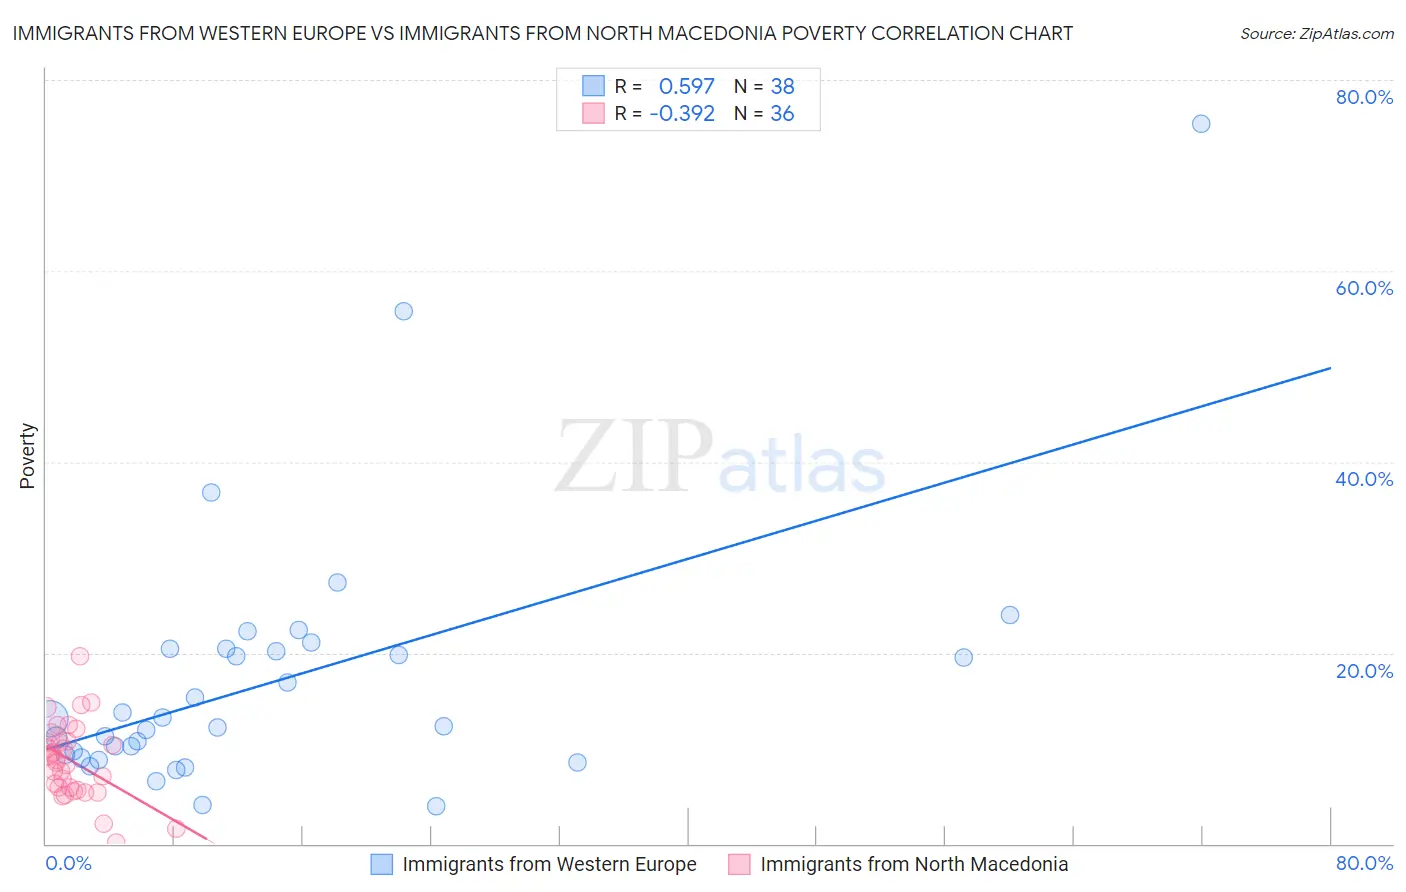
Immigrants from Western Europe vs Immigrants from North Macedonia Poverty Correlation Chart
The statistical analysis conducted on geographies consisting of 493,769,922 people shows a substantial positive correlation between the proportion of Immigrants from Western Europe and poverty level in the United States with a correlation coefficient (R) of 0.597 and weighted average of 11.8%. Similarly, the statistical analysis conducted on geographies consisting of 74,289,805 people shows a mild negative correlation between the proportion of Immigrants from North Macedonia and poverty level in the United States with a correlation coefficient (R) of -0.392 and weighted average of 10.6%, a difference of 11.6%.
Poverty Correlation Summary
| Measurement | Immigrants from Western Europe | Immigrants from North Macedonia |
| Minimum | 3.9% | 0.071% |
| Maximum | 75.4% | 19.6% |
| Range | 71.5% | 19.5% |
| Mean | 17.1% | 8.6% |
| Median | 12.7% | 8.7% |
| Interquartile 25% (IQ1) | 9.3% | 5.8% |
| Interquartile 75% (IQ3) | 20.4% | 10.7% |
| Interquartile Range (IQR) | 11.1% | 4.9% |
| Standard Deviation (Sample) | 13.7% | 4.0% |
| Standard Deviation (Population) | 13.5% | 3.9% |
Similar Demographics by Poverty
Demographics Similar to Immigrants from Western Europe by Poverty
In terms of poverty, the demographic groups most similar to Immigrants from Western Europe are Yugoslavian (11.8%, a difference of 0.010%), Immigrants from Vietnam (11.8%, a difference of 0.020%), Peruvian (11.8%, a difference of 0.070%), French (11.8%, a difference of 0.19%), and Chilean (11.8%, a difference of 0.21%).
| Demographics | Rating | Rank | Poverty |
| Immigrants | Norway | 88.0 /100 | #126 | Excellent 11.7% |
| Immigrants | Argentina | 88.0 /100 | #127 | Excellent 11.7% |
| Immigrants | Israel | 87.4 /100 | #128 | Excellent 11.7% |
| South Africans | 87.0 /100 | #129 | Excellent 11.7% |
| Immigrants | Ukraine | 86.6 /100 | #130 | Excellent 11.8% |
| French | 86.1 /100 | #131 | Excellent 11.8% |
| Peruvians | 85.6 /100 | #132 | Excellent 11.8% |
| Immigrants | Western Europe | 85.2 /100 | #133 | Excellent 11.8% |
| Yugoslavians | 85.2 /100 | #134 | Excellent 11.8% |
| Immigrants | Vietnam | 85.2 /100 | #135 | Excellent 11.8% |
| Chileans | 84.2 /100 | #136 | Excellent 11.8% |
| Immigrants | Switzerland | 83.0 /100 | #137 | Excellent 11.8% |
| Immigrants | Jordan | 82.4 /100 | #138 | Excellent 11.9% |
| Pakistanis | 82.2 /100 | #139 | Excellent 11.9% |
| Immigrants | Peru | 81.1 /100 | #140 | Excellent 11.9% |
Demographics Similar to Immigrants from North Macedonia by Poverty
In terms of poverty, the demographic groups most similar to Immigrants from North Macedonia are Luxembourger (10.6%, a difference of 0.080%), Immigrants from Scotland (10.6%, a difference of 0.11%), Eastern European (10.6%, a difference of 0.24%), Swedish (10.6%, a difference of 0.34%), and Italian (10.6%, a difference of 0.39%).
| Demographics | Rating | Rank | Poverty |
| Immigrants | Hong Kong | 99.8 /100 | #13 | Exceptional 10.4% |
| Immigrants | Bolivia | 99.8 /100 | #14 | Exceptional 10.4% |
| Bolivians | 99.8 /100 | #15 | Exceptional 10.4% |
| Lithuanians | 99.8 /100 | #16 | Exceptional 10.5% |
| Norwegians | 99.8 /100 | #17 | Exceptional 10.5% |
| Latvians | 99.8 /100 | #18 | Exceptional 10.5% |
| Immigrants | Scotland | 99.7 /100 | #19 | Exceptional 10.6% |
| Immigrants | North Macedonia | 99.7 /100 | #20 | Exceptional 10.6% |
| Luxembourgers | 99.7 /100 | #21 | Exceptional 10.6% |
| Eastern Europeans | 99.7 /100 | #22 | Exceptional 10.6% |
| Swedes | 99.7 /100 | #23 | Exceptional 10.6% |
| Italians | 99.7 /100 | #24 | Exceptional 10.6% |
| Croatians | 99.6 /100 | #25 | Exceptional 10.6% |
| Burmese | 99.6 /100 | #26 | Exceptional 10.7% |
| Immigrants | Northern Europe | 99.6 /100 | #27 | Exceptional 10.7% |