Immigrants from Western Europe vs Immigrants from Germany Child Poverty Among Girls Under 16
COMPARE
Immigrants from Western Europe
Immigrants from Germany
Child Poverty Among Girls Under 16
Child Poverty Among Girls Under 16 Comparison
Immigrants from Western Europe
Immigrants from Germany
15.4%
CHILD POVERTY AMONG GIRLS UNDER 16
90.0/ 100
METRIC RATING
131st/ 347
METRIC RANK
16.1%
CHILD POVERTY AMONG GIRLS UNDER 16
67.3/ 100
METRIC RATING
165th/ 347
METRIC RANK
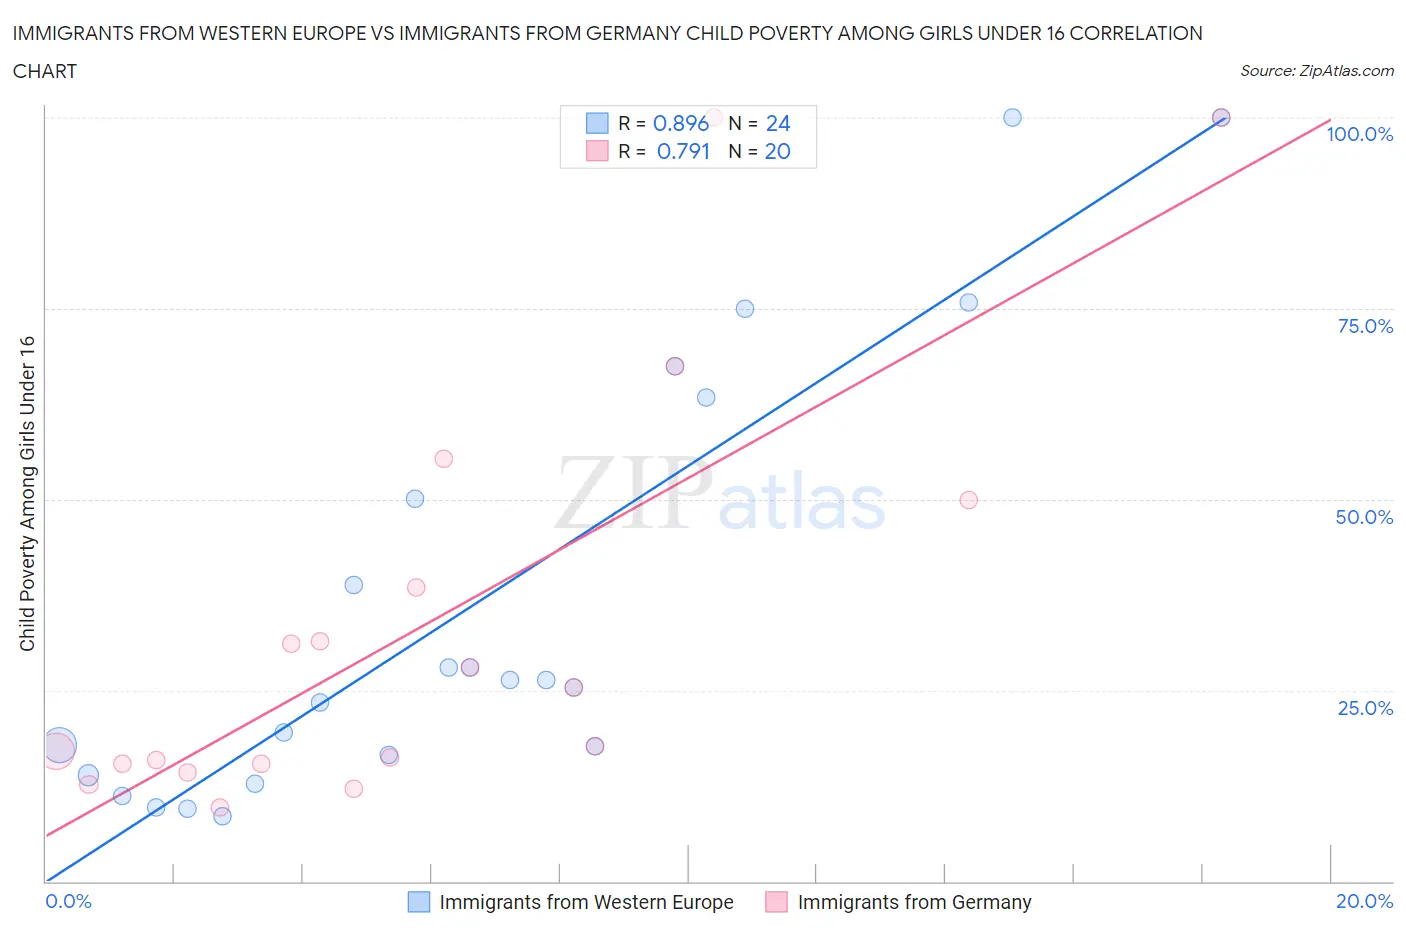
Immigrants from Western Europe vs Immigrants from Germany Child Poverty Among Girls Under 16 Correlation Chart
The statistical analysis conducted on geographies consisting of 480,598,511 people shows a very strong positive correlation between the proportion of Immigrants from Western Europe and poverty level among girls under the age of 16 in the United States with a correlation coefficient (R) of 0.896 and weighted average of 15.4%. Similarly, the statistical analysis conducted on geographies consisting of 452,830,087 people shows a strong positive correlation between the proportion of Immigrants from Germany and poverty level among girls under the age of 16 in the United States with a correlation coefficient (R) of 0.791 and weighted average of 16.1%, a difference of 4.5%.
Child Poverty Among Girls Under 16 Correlation Summary
| Measurement | Immigrants from Western Europe | Immigrants from Germany |
| Minimum | 8.4% | 9.6% |
| Maximum | 100.0% | 100.0% |
| Range | 91.6% | 90.4% |
| Mean | 36.0% | 33.7% |
| Median | 25.8% | 21.5% |
| Interquartile 25% (IQ1) | 15.2% | 15.4% |
| Interquartile 75% (IQ3) | 56.7% | 44.3% |
| Interquartile Range (IQR) | 41.4% | 28.9% |
| Standard Deviation (Sample) | 28.7% | 27.6% |
| Standard Deviation (Population) | 28.1% | 26.9% |
Similar Demographics by Child Poverty Among Girls Under 16
Demographics Similar to Immigrants from Western Europe by Child Poverty Among Girls Under 16
In terms of child poverty among girls under 16, the demographic groups most similar to Immigrants from Western Europe are Puget Sound Salish (15.4%, a difference of 0.020%), Mongolian (15.4%, a difference of 0.11%), Brazilian (15.4%, a difference of 0.13%), Immigrants from South Eastern Asia (15.4%, a difference of 0.18%), and Albanian (15.4%, a difference of 0.19%).
| Demographics | Rating | Rank | Child Poverty Among Girls Under 16 |
| Carpatho Rusyns | 91.4 /100 | #124 | Exceptional 15.3% |
| Peruvians | 91.2 /100 | #125 | Exceptional 15.4% |
| Scottish | 91.0 /100 | #126 | Exceptional 15.4% |
| Immigrants | Norway | 90.8 /100 | #127 | Exceptional 15.4% |
| Albanians | 90.5 /100 | #128 | Exceptional 15.4% |
| Immigrants | South Eastern Asia | 90.5 /100 | #129 | Exceptional 15.4% |
| Puget Sound Salish | 90.1 /100 | #130 | Exceptional 15.4% |
| Immigrants | Western Europe | 90.0 /100 | #131 | Exceptional 15.4% |
| Mongolians | 89.7 /100 | #132 | Excellent 15.4% |
| Brazilians | 89.6 /100 | #133 | Excellent 15.4% |
| Immigrants | Spain | 89.1 /100 | #134 | Excellent 15.5% |
| Czechoslovakians | 89.0 /100 | #135 | Excellent 15.5% |
| Native Hawaiians | 89.0 /100 | #136 | Excellent 15.5% |
| South Africans | 88.7 /100 | #137 | Excellent 15.5% |
| Immigrants | Vietnam | 88.2 /100 | #138 | Excellent 15.5% |
Demographics Similar to Immigrants from Germany by Child Poverty Among Girls Under 16
In terms of child poverty among girls under 16, the demographic groups most similar to Immigrants from Germany are South American (16.1%, a difference of 0.020%), Immigrants from Colombia (16.1%, a difference of 0.070%), Immigrants from Oceania (16.1%, a difference of 0.14%), French Canadian (16.1%, a difference of 0.19%), and Uruguayan (16.2%, a difference of 0.34%).
| Demographics | Rating | Rank | Child Poverty Among Girls Under 16 |
| Guamanians/Chamorros | 75.3 /100 | #158 | Good 15.9% |
| Slovaks | 75.2 /100 | #159 | Good 15.9% |
| French | 72.8 /100 | #160 | Good 16.0% |
| Immigrants | Northern Africa | 72.0 /100 | #161 | Good 16.0% |
| French Canadians | 68.7 /100 | #162 | Good 16.1% |
| Immigrants | Oceania | 68.4 /100 | #163 | Good 16.1% |
| Immigrants | Colombia | 67.8 /100 | #164 | Good 16.1% |
| Immigrants | Germany | 67.3 /100 | #165 | Good 16.1% |
| South Americans | 67.2 /100 | #166 | Good 16.1% |
| Uruguayans | 64.7 /100 | #167 | Good 16.2% |
| Yugoslavians | 64.4 /100 | #168 | Good 16.2% |
| Costa Ricans | 64.2 /100 | #169 | Good 16.2% |
| Immigrants | Venezuela | 64.2 /100 | #170 | Good 16.2% |
| Immigrants | Saudi Arabia | 64.0 /100 | #171 | Good 16.2% |
| Afghans | 62.3 /100 | #172 | Good 16.2% |