Immigrants from Iraq vs Immigrants from Germany Child Poverty Among Girls Under 16
COMPARE
Immigrants from Iraq
Immigrants from Germany
Child Poverty Among Girls Under 16
Child Poverty Among Girls Under 16 Comparison
Immigrants from Iraq
Immigrants from Germany
16.6%
CHILD POVERTY AMONG GIRLS UNDER 16
43.2/ 100
METRIC RATING
181st/ 347
METRIC RANK
16.1%
CHILD POVERTY AMONG GIRLS UNDER 16
67.3/ 100
METRIC RATING
165th/ 347
METRIC RANK
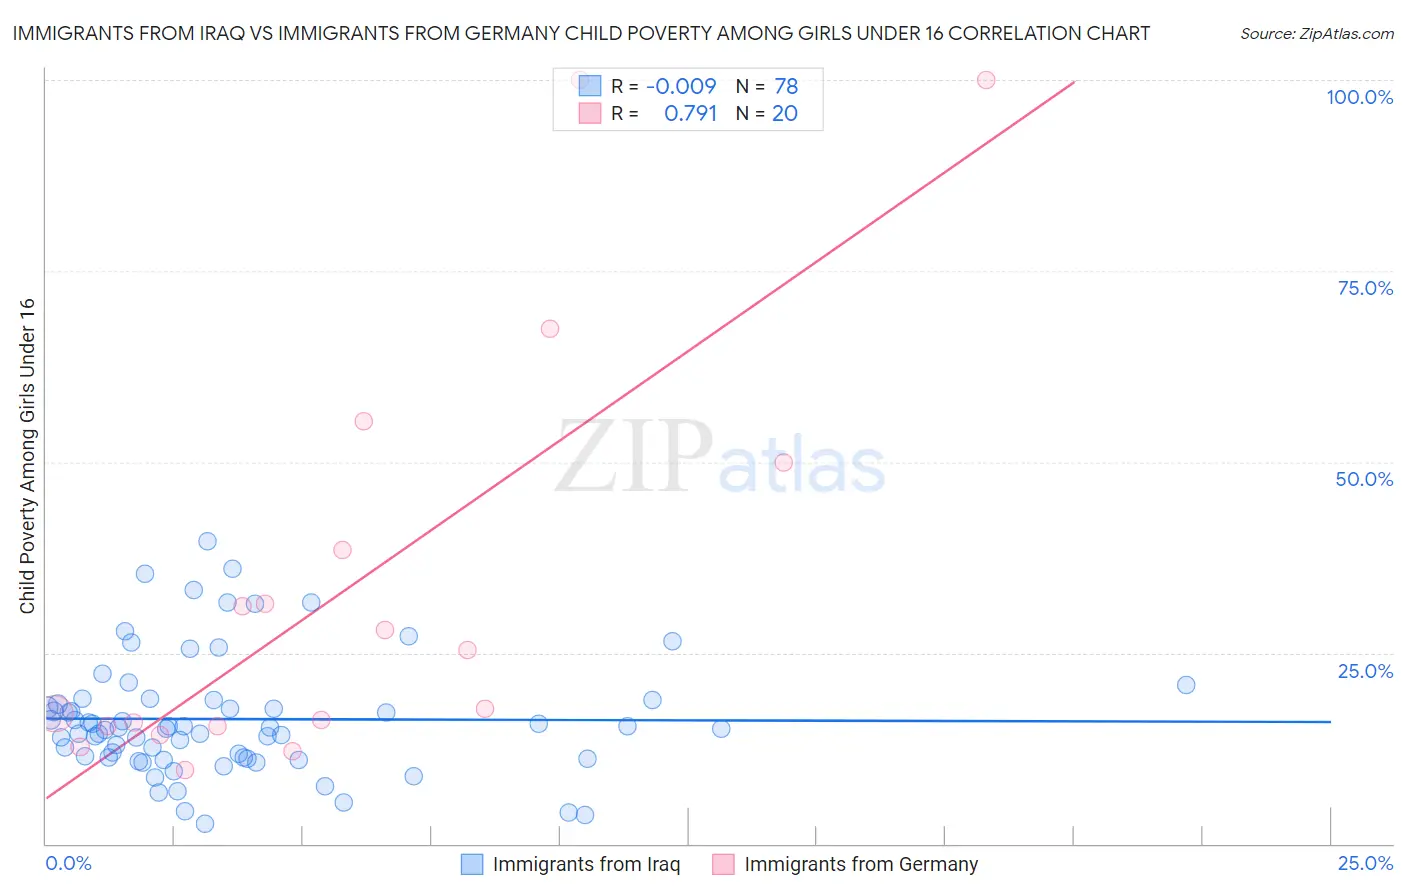
Immigrants from Iraq vs Immigrants from Germany Child Poverty Among Girls Under 16 Correlation Chart
The statistical analysis conducted on geographies consisting of 193,254,093 people shows no correlation between the proportion of Immigrants from Iraq and poverty level among girls under the age of 16 in the United States with a correlation coefficient (R) of -0.009 and weighted average of 16.6%. Similarly, the statistical analysis conducted on geographies consisting of 452,830,087 people shows a strong positive correlation between the proportion of Immigrants from Germany and poverty level among girls under the age of 16 in the United States with a correlation coefficient (R) of 0.791 and weighted average of 16.1%, a difference of 2.9%.
Child Poverty Among Girls Under 16 Correlation Summary
| Measurement | Immigrants from Iraq | Immigrants from Germany |
| Minimum | 2.6% | 9.6% |
| Maximum | 39.6% | 100.0% |
| Range | 37.1% | 90.4% |
| Mean | 16.3% | 33.7% |
| Median | 15.1% | 21.5% |
| Interquartile 25% (IQ1) | 11.3% | 15.4% |
| Interquartile 75% (IQ3) | 18.8% | 44.3% |
| Interquartile Range (IQR) | 7.5% | 28.9% |
| Standard Deviation (Sample) | 7.8% | 27.6% |
| Standard Deviation (Population) | 7.7% | 26.9% |
Demographics Similar to Immigrants from Iraq and Immigrants from Germany by Child Poverty Among Girls Under 16
In terms of child poverty among girls under 16, the demographic groups most similar to Immigrants from Iraq are Immigrants from Ethiopia (16.6%, a difference of 0.010%), Immigrants from Syria (16.6%, a difference of 0.020%), Hawaiian (16.6%, a difference of 0.030%), White/Caucasian (16.6%, a difference of 0.060%), and Immigrants from Portugal (16.6%, a difference of 0.080%). Similarly, the demographic groups most similar to Immigrants from Germany are South American (16.1%, a difference of 0.020%), Immigrants from Colombia (16.1%, a difference of 0.070%), Immigrants from Oceania (16.1%, a difference of 0.14%), Uruguayan (16.2%, a difference of 0.34%), and Yugoslavian (16.2%, a difference of 0.38%).
| Demographics | Rating | Rank | Child Poverty Among Girls Under 16 |
| Immigrants | Oceania | 68.4 /100 | #163 | Good 16.1% |
| Immigrants | Colombia | 67.8 /100 | #164 | Good 16.1% |
| Immigrants | Germany | 67.3 /100 | #165 | Good 16.1% |
| South Americans | 67.2 /100 | #166 | Good 16.1% |
| Uruguayans | 64.7 /100 | #167 | Good 16.2% |
| Yugoslavians | 64.4 /100 | #168 | Good 16.2% |
| Costa Ricans | 64.2 /100 | #169 | Good 16.2% |
| Immigrants | Venezuela | 64.2 /100 | #170 | Good 16.2% |
| Immigrants | Saudi Arabia | 64.0 /100 | #171 | Good 16.2% |
| Afghans | 62.3 /100 | #172 | Good 16.2% |
| Immigrants | South America | 55.1 /100 | #173 | Average 16.4% |
| Ethiopians | 50.0 /100 | #174 | Average 16.5% |
| Lebanese | 45.4 /100 | #175 | Average 16.6% |
| Hungarians | 45.1 /100 | #176 | Average 16.6% |
| Immigrants | Western Asia | 44.1 /100 | #177 | Average 16.6% |
| Whites/Caucasians | 43.6 /100 | #178 | Average 16.6% |
| Hawaiians | 43.4 /100 | #179 | Average 16.6% |
| Immigrants | Syria | 43.3 /100 | #180 | Average 16.6% |
| Immigrants | Iraq | 43.2 /100 | #181 | Average 16.6% |
| Immigrants | Ethiopia | 43.1 /100 | #182 | Average 16.6% |
| Immigrants | Portugal | 42.5 /100 | #183 | Average 16.6% |