Immigrants from Western Asia vs Japanese Seniors Poverty Over the Age of 75
COMPARE
Immigrants from Western Asia
Japanese
Seniors Poverty Over the Age of 75
Seniors Poverty Over the Age of 75 Comparison
Immigrants from Western Asia
Japanese
12.9%
SENIORS POVERTY OVER THE AGE OF 75
4.9/ 100
METRIC RATING
218th/ 347
METRIC RANK
13.3%
SENIORS POVERTY OVER THE AGE OF 75
0.9/ 100
METRIC RATING
235th/ 347
METRIC RANK
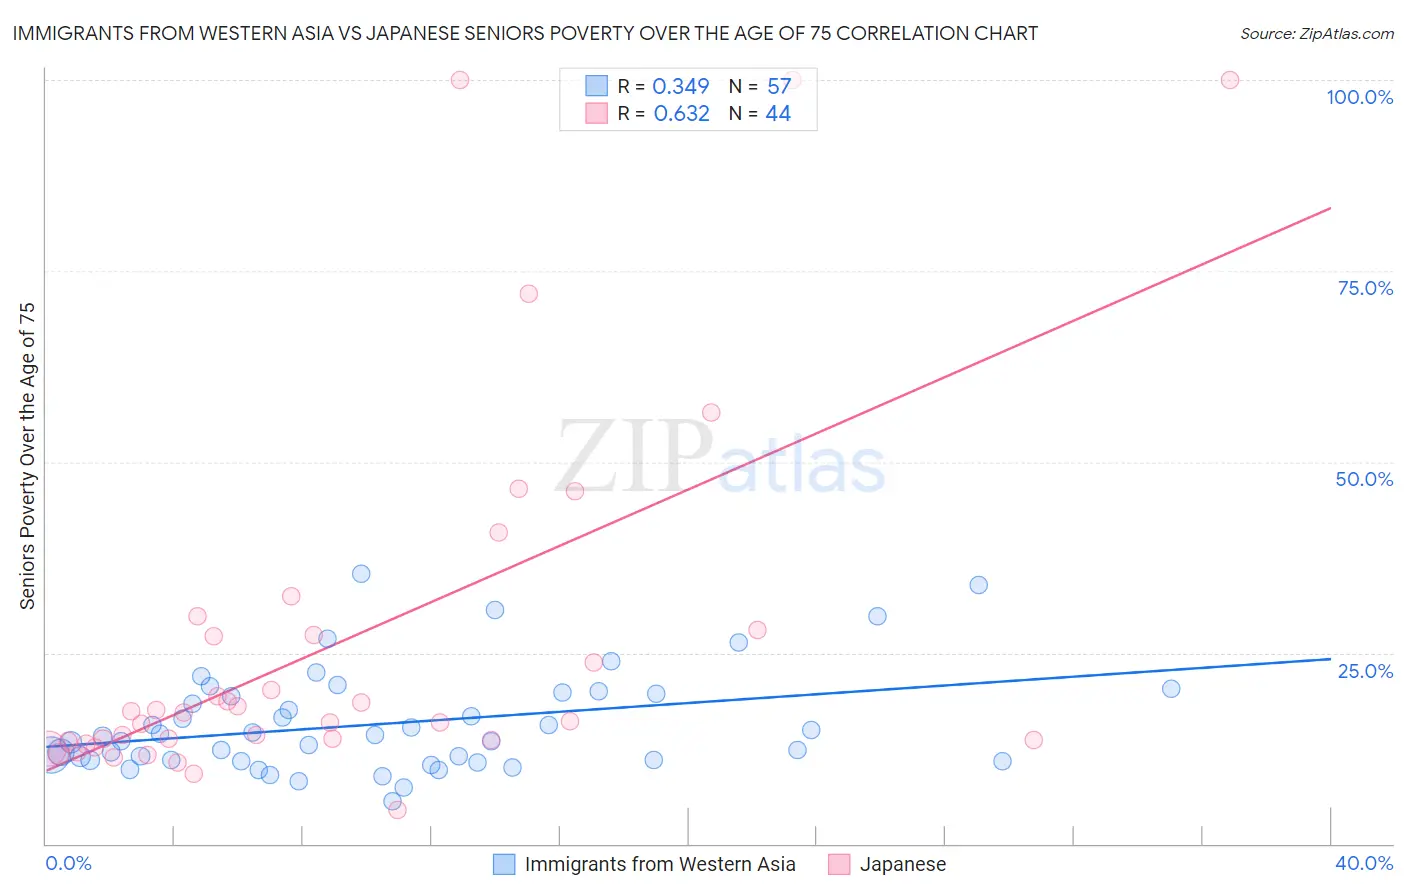
Immigrants from Western Asia vs Japanese Seniors Poverty Over the Age of 75 Correlation Chart
The statistical analysis conducted on geographies consisting of 399,569,345 people shows a mild positive correlation between the proportion of Immigrants from Western Asia and poverty level among seniors over the age of 75 in the United States with a correlation coefficient (R) of 0.349 and weighted average of 12.9%. Similarly, the statistical analysis conducted on geographies consisting of 247,327,064 people shows a significant positive correlation between the proportion of Japanese and poverty level among seniors over the age of 75 in the United States with a correlation coefficient (R) of 0.632 and weighted average of 13.3%, a difference of 3.2%.
Seniors Poverty Over the Age of 75 Correlation Summary
| Measurement | Immigrants from Western Asia | Japanese |
| Minimum | 5.6% | 4.3% |
| Maximum | 35.3% | 100.0% |
| Range | 29.7% | 95.7% |
| Mean | 15.7% | 26.4% |
| Median | 14.0% | 16.6% |
| Interquartile 25% (IQ1) | 10.9% | 13.5% |
| Interquartile 75% (IQ3) | 19.7% | 27.6% |
| Interquartile Range (IQR) | 8.8% | 14.1% |
| Standard Deviation (Sample) | 6.6% | 24.1% |
| Standard Deviation (Population) | 6.6% | 23.8% |
Demographics Similar to Immigrants from Western Asia and Japanese by Seniors Poverty Over the Age of 75
In terms of seniors poverty over the age of 75, the demographic groups most similar to Immigrants from Western Asia are Bermudan (12.9%, a difference of 0.030%), Ute (12.9%, a difference of 0.060%), Immigrants from Brazil (12.9%, a difference of 0.12%), Seminole (12.9%, a difference of 0.17%), and Immigrants from Kazakhstan (13.0%, a difference of 0.26%). Similarly, the demographic groups most similar to Japanese are Moroccan (13.3%, a difference of 0.020%), Immigrants from Israel (13.3%, a difference of 0.30%), Immigrants from Costa Rica (13.3%, a difference of 0.64%), Immigrants from Chile (13.3%, a difference of 0.67%), and Subsaharan African (13.2%, a difference of 0.88%).
| Demographics | Rating | Rank | Seniors Poverty Over the Age of 75 |
| Immigrants | Brazil | 5.2 /100 | #216 | Tragic 12.9% |
| Bermudans | 4.9 /100 | #217 | Tragic 12.9% |
| Immigrants | Western Asia | 4.9 /100 | #218 | Tragic 12.9% |
| Ute | 4.7 /100 | #219 | Tragic 12.9% |
| Seminole | 4.5 /100 | #220 | Tragic 12.9% |
| Immigrants | Kazakhstan | 4.3 /100 | #221 | Tragic 13.0% |
| Nigerians | 3.4 /100 | #222 | Tragic 13.0% |
| Immigrants | Nigeria | 3.3 /100 | #223 | Tragic 13.0% |
| Chippewa | 2.9 /100 | #224 | Tragic 13.1% |
| Immigrants | Morocco | 2.8 /100 | #225 | Tragic 13.1% |
| Shoshone | 2.6 /100 | #226 | Tragic 13.1% |
| Cree | 2.3 /100 | #227 | Tragic 13.1% |
| Israelis | 2.0 /100 | #228 | Tragic 13.2% |
| Somalis | 1.6 /100 | #229 | Tragic 13.2% |
| Immigrants | China | 1.5 /100 | #230 | Tragic 13.2% |
| Sub-Saharan Africans | 1.5 /100 | #231 | Tragic 13.2% |
| Immigrants | Chile | 1.3 /100 | #232 | Tragic 13.3% |
| Immigrants | Costa Rica | 1.3 /100 | #233 | Tragic 13.3% |
| Immigrants | Israel | 1.1 /100 | #234 | Tragic 13.3% |
| Japanese | 0.9 /100 | #235 | Tragic 13.3% |
| Moroccans | 0.9 /100 | #236 | Tragic 13.3% |