Vietnamese vs Japanese Seniors Poverty Over the Age of 75
COMPARE
Vietnamese
Japanese
Seniors Poverty Over the Age of 75
Seniors Poverty Over the Age of 75 Comparison
Vietnamese
Japanese
15.9%
SENIORS POVERTY OVER THE AGE OF 75
0.0/ 100
METRIC RATING
310th/ 347
METRIC RANK
13.3%
SENIORS POVERTY OVER THE AGE OF 75
0.9/ 100
METRIC RATING
235th/ 347
METRIC RANK
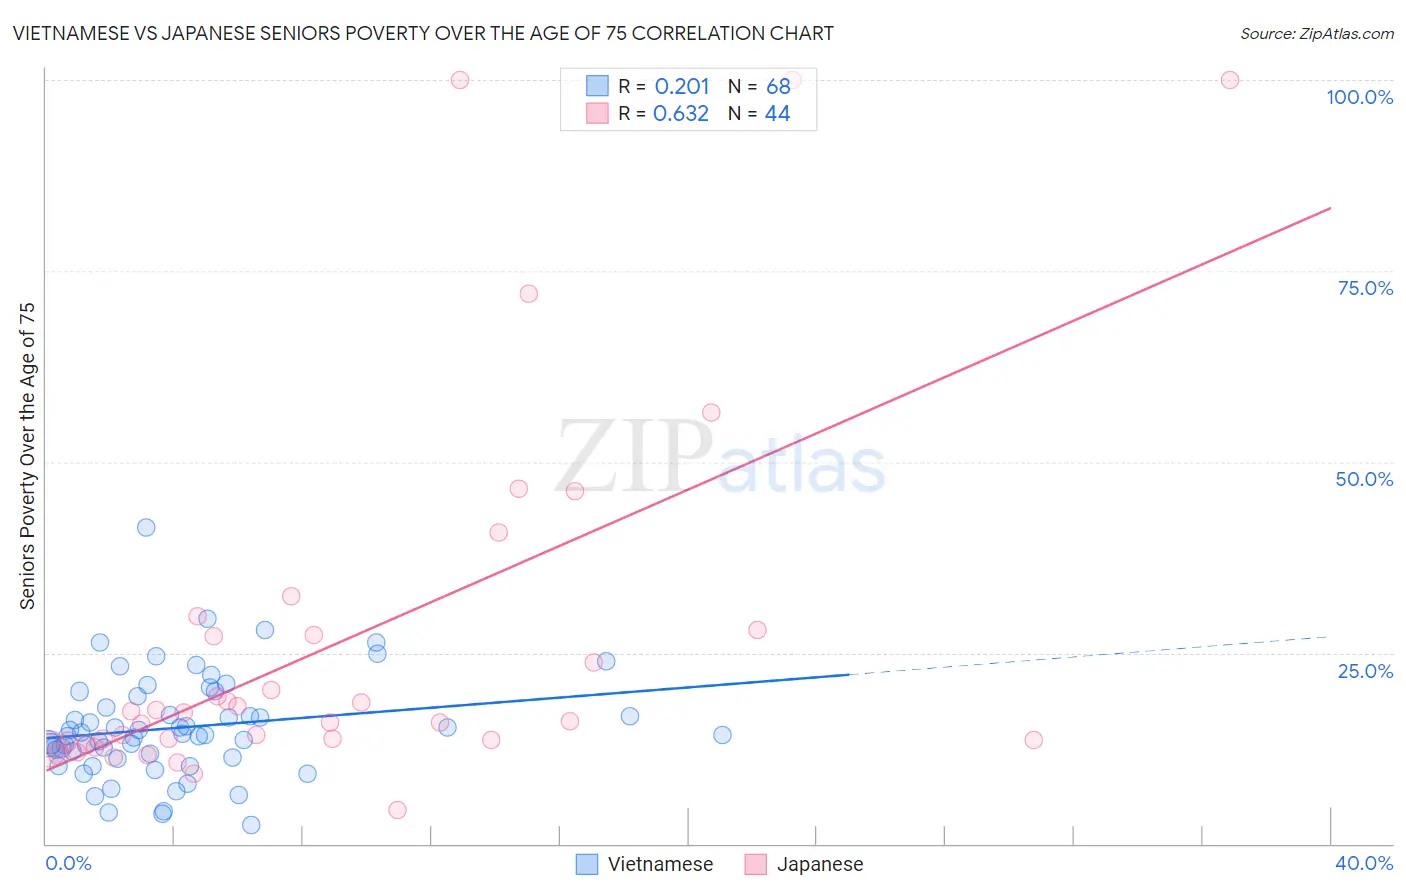
Vietnamese vs Japanese Seniors Poverty Over the Age of 75 Correlation Chart
The statistical analysis conducted on geographies consisting of 169,621,093 people shows a weak positive correlation between the proportion of Vietnamese and poverty level among seniors over the age of 75 in the United States with a correlation coefficient (R) of 0.201 and weighted average of 15.9%. Similarly, the statistical analysis conducted on geographies consisting of 247,327,064 people shows a significant positive correlation between the proportion of Japanese and poverty level among seniors over the age of 75 in the United States with a correlation coefficient (R) of 0.632 and weighted average of 13.3%, a difference of 18.9%.
Seniors Poverty Over the Age of 75 Correlation Summary
| Measurement | Vietnamese | Japanese |
| Minimum | 2.5% | 4.3% |
| Maximum | 41.4% | 100.0% |
| Range | 38.9% | 95.7% |
| Mean | 15.2% | 26.4% |
| Median | 14.3% | 16.6% |
| Interquartile 25% (IQ1) | 11.5% | 13.5% |
| Interquartile 75% (IQ3) | 18.6% | 27.6% |
| Interquartile Range (IQR) | 7.0% | 14.1% |
| Standard Deviation (Sample) | 6.8% | 24.1% |
| Standard Deviation (Population) | 6.7% | 23.8% |
Similar Demographics by Seniors Poverty Over the Age of 75
Demographics Similar to Vietnamese by Seniors Poverty Over the Age of 75
In terms of seniors poverty over the age of 75, the demographic groups most similar to Vietnamese are Yup'ik (15.8%, a difference of 0.10%), Trinidadian and Tobagonian (15.9%, a difference of 0.10%), Immigrants from Bangladesh (15.8%, a difference of 0.40%), Immigrants from West Indies (15.8%, a difference of 0.44%), and Crow (15.9%, a difference of 0.51%).
| Demographics | Rating | Rank | Seniors Poverty Over the Age of 75 |
| Immigrants | Honduras | 0.0 /100 | #303 | Tragic 15.7% |
| Immigrants | Trinidad and Tobago | 0.0 /100 | #304 | Tragic 15.7% |
| Ecuadorians | 0.0 /100 | #305 | Tragic 15.7% |
| Hispanics or Latinos | 0.0 /100 | #306 | Tragic 15.8% |
| Immigrants | West Indies | 0.0 /100 | #307 | Tragic 15.8% |
| Immigrants | Bangladesh | 0.0 /100 | #308 | Tragic 15.8% |
| Yup'ik | 0.0 /100 | #309 | Tragic 15.8% |
| Vietnamese | 0.0 /100 | #310 | Tragic 15.9% |
| Trinidadians and Tobagonians | 0.0 /100 | #311 | Tragic 15.9% |
| Crow | 0.0 /100 | #312 | Tragic 15.9% |
| Barbadians | 0.0 /100 | #313 | Tragic 16.0% |
| Tsimshian | 0.0 /100 | #314 | Tragic 16.1% |
| Guyanese | 0.0 /100 | #315 | Tragic 16.1% |
| Immigrants | Ecuador | 0.0 /100 | #316 | Tragic 16.1% |
| Immigrants | Guyana | 0.0 /100 | #317 | Tragic 16.2% |
Demographics Similar to Japanese by Seniors Poverty Over the Age of 75
In terms of seniors poverty over the age of 75, the demographic groups most similar to Japanese are Moroccan (13.3%, a difference of 0.020%), Alaskan Athabascan (13.4%, a difference of 0.19%), Peruvian (13.4%, a difference of 0.21%), Immigrants from Israel (13.3%, a difference of 0.30%), and Panamanian (13.4%, a difference of 0.31%).
| Demographics | Rating | Rank | Seniors Poverty Over the Age of 75 |
| Israelis | 2.0 /100 | #228 | Tragic 13.2% |
| Somalis | 1.6 /100 | #229 | Tragic 13.2% |
| Immigrants | China | 1.5 /100 | #230 | Tragic 13.2% |
| Sub-Saharan Africans | 1.5 /100 | #231 | Tragic 13.2% |
| Immigrants | Chile | 1.3 /100 | #232 | Tragic 13.3% |
| Immigrants | Costa Rica | 1.3 /100 | #233 | Tragic 13.3% |
| Immigrants | Israel | 1.1 /100 | #234 | Tragic 13.3% |
| Japanese | 0.9 /100 | #235 | Tragic 13.3% |
| Moroccans | 0.9 /100 | #236 | Tragic 13.3% |
| Alaskan Athabascans | 0.8 /100 | #237 | Tragic 13.4% |
| Peruvians | 0.8 /100 | #238 | Tragic 13.4% |
| Panamanians | 0.8 /100 | #239 | Tragic 13.4% |
| Argentineans | 0.7 /100 | #240 | Tragic 13.4% |
| Immigrants | Russia | 0.6 /100 | #241 | Tragic 13.4% |
| Immigrants | Somalia | 0.6 /100 | #242 | Tragic 13.5% |