Immigrants from Western Asia vs Immigrants from Peru Seniors Poverty Over the Age of 75
COMPARE
Immigrants from Western Asia
Immigrants from Peru
Seniors Poverty Over the Age of 75
Seniors Poverty Over the Age of 75 Comparison
Immigrants from Western Asia
Immigrants from Peru
12.9%
SENIORS POVERTY OVER THE AGE OF 75
4.9/ 100
METRIC RATING
218th/ 347
METRIC RANK
13.7%
SENIORS POVERTY OVER THE AGE OF 75
0.3/ 100
METRIC RATING
251st/ 347
METRIC RANK
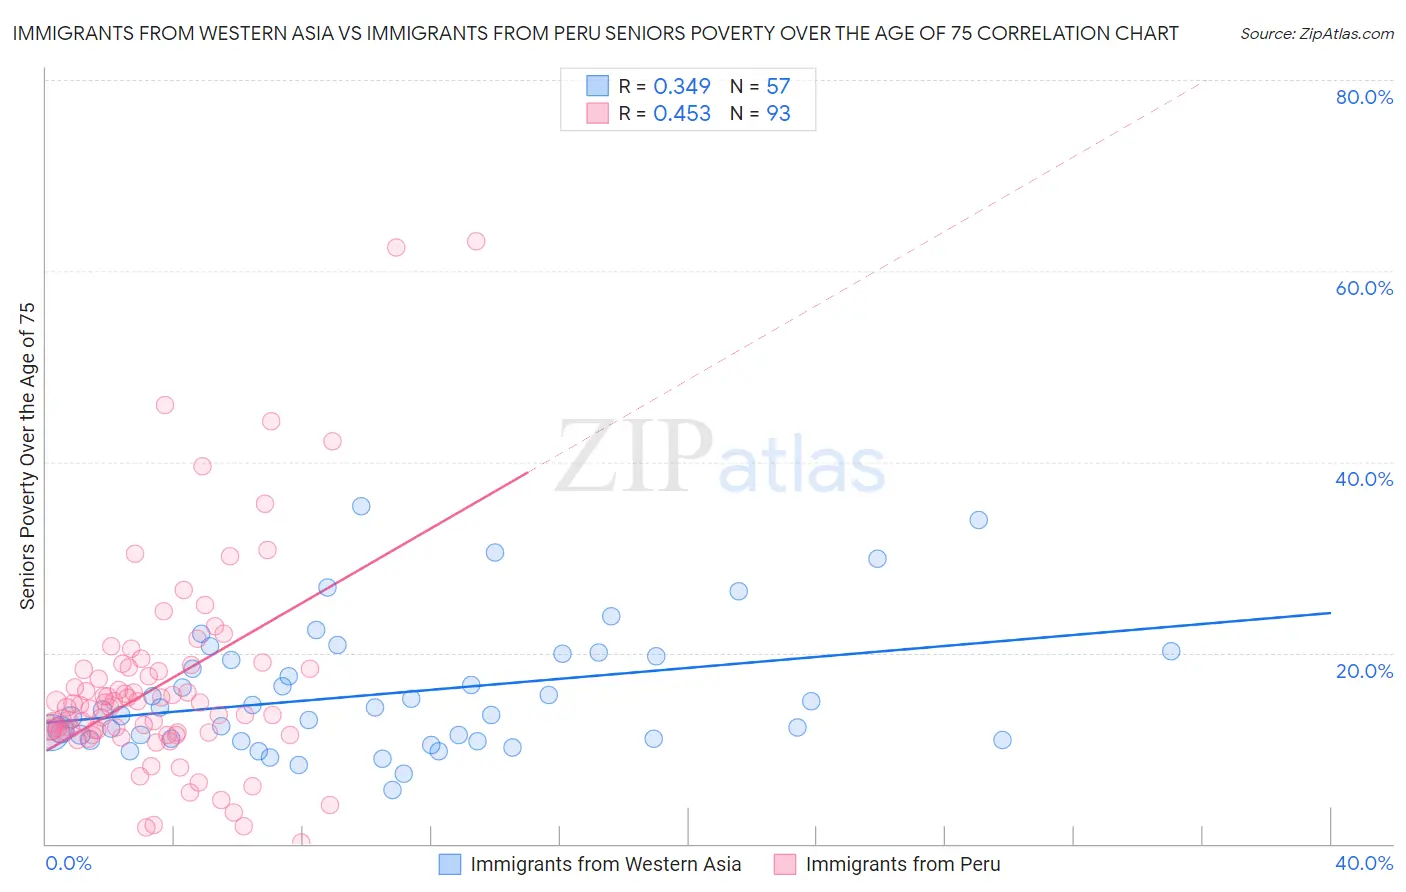
Immigrants from Western Asia vs Immigrants from Peru Seniors Poverty Over the Age of 75 Correlation Chart
The statistical analysis conducted on geographies consisting of 399,569,345 people shows a mild positive correlation between the proportion of Immigrants from Western Asia and poverty level among seniors over the age of 75 in the United States with a correlation coefficient (R) of 0.349 and weighted average of 12.9%. Similarly, the statistical analysis conducted on geographies consisting of 326,168,143 people shows a moderate positive correlation between the proportion of Immigrants from Peru and poverty level among seniors over the age of 75 in the United States with a correlation coefficient (R) of 0.453 and weighted average of 13.7%, a difference of 5.7%.
Seniors Poverty Over the Age of 75 Correlation Summary
| Measurement | Immigrants from Western Asia | Immigrants from Peru |
| Minimum | 5.6% | 0.17% |
| Maximum | 35.3% | 63.2% |
| Range | 29.7% | 63.0% |
| Mean | 15.7% | 16.6% |
| Median | 14.0% | 14.3% |
| Interquartile 25% (IQ1) | 10.9% | 11.6% |
| Interquartile 75% (IQ3) | 19.7% | 18.4% |
| Interquartile Range (IQR) | 8.8% | 6.8% |
| Standard Deviation (Sample) | 6.6% | 11.0% |
| Standard Deviation (Population) | 6.6% | 10.9% |
Similar Demographics by Seniors Poverty Over the Age of 75
Demographics Similar to Immigrants from Western Asia by Seniors Poverty Over the Age of 75
In terms of seniors poverty over the age of 75, the demographic groups most similar to Immigrants from Western Asia are Bermudan (12.9%, a difference of 0.030%), Ute (12.9%, a difference of 0.060%), Immigrants from Brazil (12.9%, a difference of 0.12%), Seminole (12.9%, a difference of 0.17%), and South American Indian (12.9%, a difference of 0.24%).
| Demographics | Rating | Rank | Seniors Poverty Over the Age of 75 |
| Brazilians | 6.9 /100 | #211 | Tragic 12.8% |
| Immigrants | Hong Kong | 6.5 /100 | #212 | Tragic 12.8% |
| French American Indians | 6.1 /100 | #213 | Tragic 12.9% |
| Immigrants | Africa | 5.9 /100 | #214 | Tragic 12.9% |
| South American Indians | 5.5 /100 | #215 | Tragic 12.9% |
| Immigrants | Brazil | 5.2 /100 | #216 | Tragic 12.9% |
| Bermudans | 4.9 /100 | #217 | Tragic 12.9% |
| Immigrants | Western Asia | 4.9 /100 | #218 | Tragic 12.9% |
| Ute | 4.7 /100 | #219 | Tragic 12.9% |
| Seminole | 4.5 /100 | #220 | Tragic 12.9% |
| Immigrants | Kazakhstan | 4.3 /100 | #221 | Tragic 13.0% |
| Nigerians | 3.4 /100 | #222 | Tragic 13.0% |
| Immigrants | Nigeria | 3.3 /100 | #223 | Tragic 13.0% |
| Chippewa | 2.9 /100 | #224 | Tragic 13.1% |
| Immigrants | Morocco | 2.8 /100 | #225 | Tragic 13.1% |
Demographics Similar to Immigrants from Peru by Seniors Poverty Over the Age of 75
In terms of seniors poverty over the age of 75, the demographic groups most similar to Immigrants from Peru are Immigrants from Argentina (13.7%, a difference of 0.050%), Immigrants from Spain (13.7%, a difference of 0.27%), Mexican American Indian (13.6%, a difference of 0.33%), Immigrants from Albania (13.6%, a difference of 0.34%), and African (13.6%, a difference of 0.35%).
| Demographics | Rating | Rank | Seniors Poverty Over the Age of 75 |
| Spanish Americans | 0.5 /100 | #244 | Tragic 13.5% |
| Uruguayans | 0.5 /100 | #245 | Tragic 13.5% |
| Immigrants | Cambodia | 0.4 /100 | #246 | Tragic 13.6% |
| Immigrants | Ukraine | 0.3 /100 | #247 | Tragic 13.6% |
| Africans | 0.3 /100 | #248 | Tragic 13.6% |
| Immigrants | Albania | 0.3 /100 | #249 | Tragic 13.6% |
| Mexican American Indians | 0.3 /100 | #250 | Tragic 13.6% |
| Immigrants | Peru | 0.3 /100 | #251 | Tragic 13.7% |
| Immigrants | Argentina | 0.3 /100 | #252 | Tragic 13.7% |
| Immigrants | Spain | 0.2 /100 | #253 | Tragic 13.7% |
| Blackfeet | 0.2 /100 | #254 | Tragic 13.7% |
| Immigrants | Belarus | 0.2 /100 | #255 | Tragic 13.8% |
| Inupiat | 0.1 /100 | #256 | Tragic 13.8% |
| Immigrants | Western Africa | 0.1 /100 | #257 | Tragic 13.9% |
| Immigrants | Panama | 0.1 /100 | #258 | Tragic 13.9% |