Immigrants from Western Asia vs Japanese Female Unemployment
COMPARE
Immigrants from Western Asia
Japanese
Female Unemployment
Female Unemployment Comparison
Immigrants from Western Asia
Japanese
5.6%
FEMALE UNEMPLOYMENT
1.1/ 100
METRIC RATING
247th/ 347
METRIC RANK
5.6%
FEMALE UNEMPLOYMENT
1.2/ 100
METRIC RATING
246th/ 347
METRIC RANK
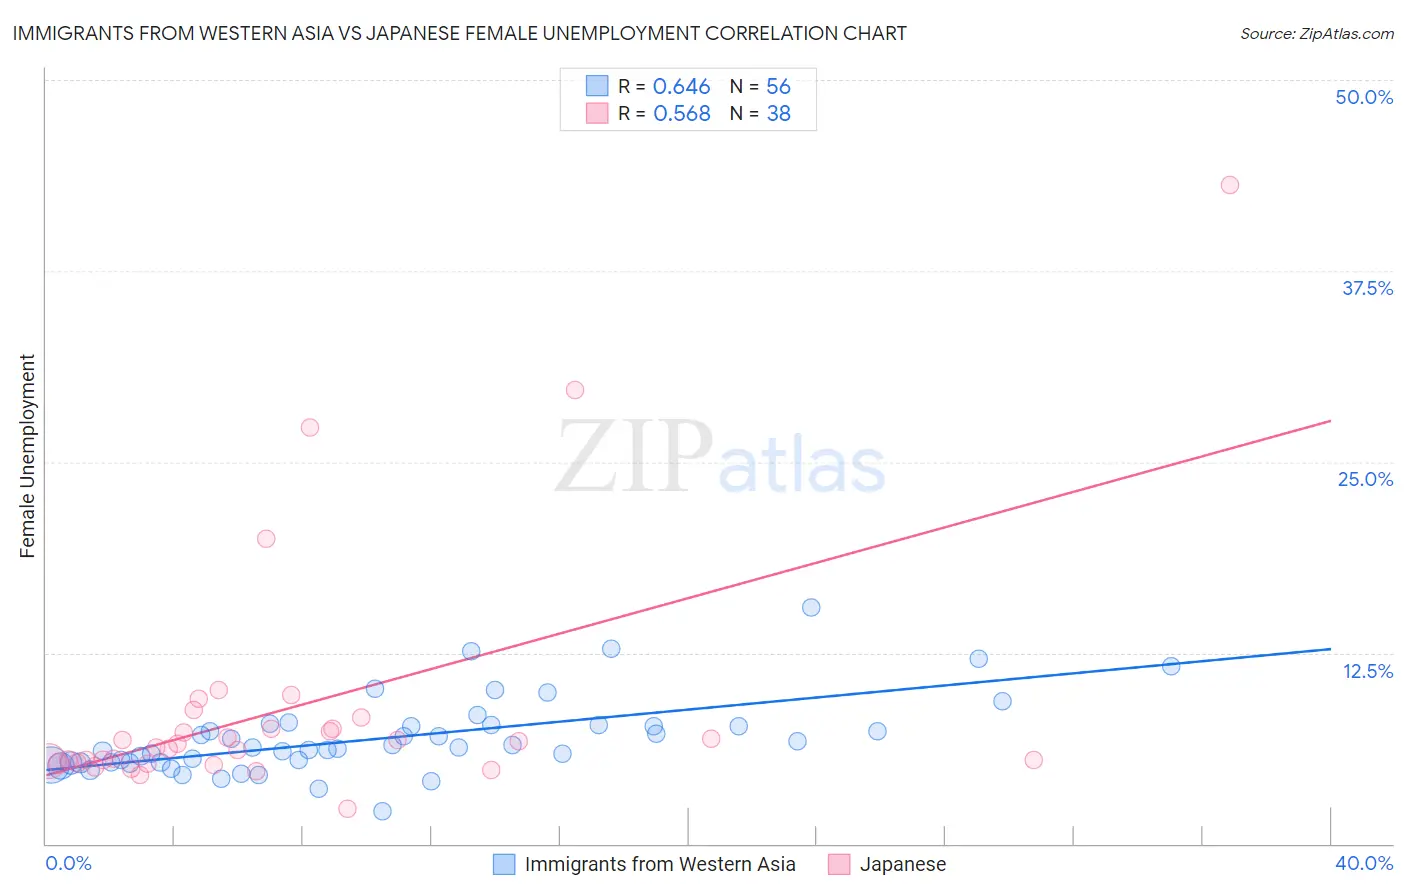
Immigrants from Western Asia vs Japanese Female Unemployment Correlation Chart
The statistical analysis conducted on geographies consisting of 402,949,071 people shows a significant positive correlation between the proportion of Immigrants from Western Asia and unemploymnet rate among females in the United States with a correlation coefficient (R) of 0.646 and weighted average of 5.6%. Similarly, the statistical analysis conducted on geographies consisting of 248,709,306 people shows a substantial positive correlation between the proportion of Japanese and unemploymnet rate among females in the United States with a correlation coefficient (R) of 0.568 and weighted average of 5.6%, a difference of 0.080%.
Female Unemployment Correlation Summary
| Measurement | Immigrants from Western Asia | Japanese |
| Minimum | 2.1% | 2.3% |
| Maximum | 15.5% | 43.1% |
| Range | 13.4% | 40.8% |
| Mean | 6.9% | 8.8% |
| Median | 6.3% | 6.4% |
| Interquartile 25% (IQ1) | 5.3% | 5.3% |
| Interquartile 75% (IQ3) | 7.8% | 7.5% |
| Interquartile Range (IQR) | 2.5% | 2.3% |
| Standard Deviation (Sample) | 2.5% | 8.0% |
| Standard Deviation (Population) | 2.5% | 7.9% |
Demographics Similar to Immigrants from Western Asia and Japanese by Female Unemployment
In terms of female unemployment, the demographic groups most similar to Immigrants from Western Asia are Cree (5.6%, a difference of 0.16%), Immigrants from Uzbekistan (5.6%, a difference of 0.20%), Guamanian/Chamorro (5.6%, a difference of 0.31%), Immigrants from Liberia (5.6%, a difference of 0.45%), and Immigrants from Syria (5.6%, a difference of 0.49%). Similarly, the demographic groups most similar to Japanese are Guamanian/Chamorro (5.6%, a difference of 0.23%), Cree (5.6%, a difference of 0.24%), Immigrants from Uzbekistan (5.6%, a difference of 0.28%), Immigrants from Liberia (5.6%, a difference of 0.37%), and Immigrants from Syria (5.6%, a difference of 0.57%).
| Demographics | Rating | Rank | Female Unemployment |
| Immigrants | Cambodia | 3.3 /100 | #236 | Tragic 5.5% |
| Immigrants | Panama | 3.2 /100 | #237 | Tragic 5.5% |
| Sierra Leoneans | 3.2 /100 | #238 | Tragic 5.5% |
| Aleuts | 3.0 /100 | #239 | Tragic 5.5% |
| Immigrants | South America | 2.9 /100 | #240 | Tragic 5.5% |
| South American Indians | 2.8 /100 | #241 | Tragic 5.5% |
| Marshallese | 2.3 /100 | #242 | Tragic 5.6% |
| Spanish Americans | 2.2 /100 | #243 | Tragic 5.6% |
| Immigrants | Liberia | 1.5 /100 | #244 | Tragic 5.6% |
| Guamanians/Chamorros | 1.4 /100 | #245 | Tragic 5.6% |
| Japanese | 1.2 /100 | #246 | Tragic 5.6% |
| Immigrants | Western Asia | 1.1 /100 | #247 | Tragic 5.6% |
| Cree | 1.0 /100 | #248 | Tragic 5.6% |
| Immigrants | Uzbekistan | 1.0 /100 | #249 | Tragic 5.6% |
| Immigrants | Syria | 0.8 /100 | #250 | Tragic 5.6% |
| Assyrians/Chaldeans/Syriacs | 0.8 /100 | #251 | Tragic 5.6% |
| Cajuns | 0.7 /100 | #252 | Tragic 5.7% |
| Immigrants | Sierra Leone | 0.6 /100 | #253 | Tragic 5.7% |
| Immigrants | Immigrants | 0.6 /100 | #254 | Tragic 5.7% |
| Immigrants | Cameroon | 0.6 /100 | #255 | Tragic 5.7% |
| Sub-Saharan Africans | 0.4 /100 | #256 | Tragic 5.7% |