Immigrants from Western Asia vs Immigrants from Honduras Seniors Poverty Over the Age of 75
COMPARE
Immigrants from Western Asia
Immigrants from Honduras
Seniors Poverty Over the Age of 75
Seniors Poverty Over the Age of 75 Comparison
Immigrants from Western Asia
Immigrants from Honduras
12.9%
SENIORS POVERTY OVER THE AGE OF 75
4.9/ 100
METRIC RATING
218th/ 347
METRIC RANK
15.7%
SENIORS POVERTY OVER THE AGE OF 75
0.0/ 100
METRIC RATING
303rd/ 347
METRIC RANK
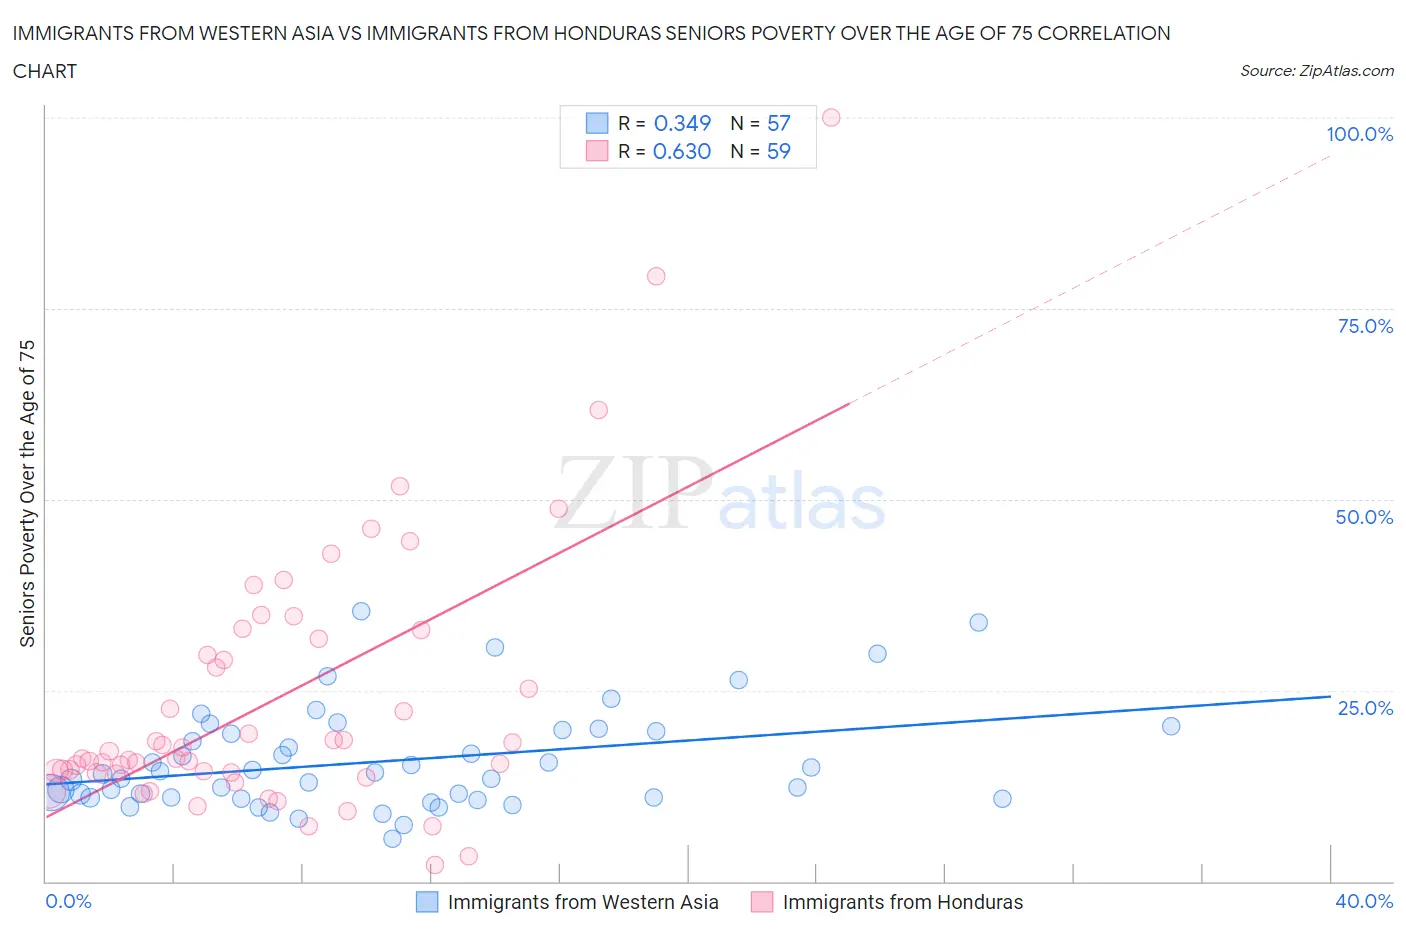
Immigrants from Western Asia vs Immigrants from Honduras Seniors Poverty Over the Age of 75 Correlation Chart
The statistical analysis conducted on geographies consisting of 399,569,345 people shows a mild positive correlation between the proportion of Immigrants from Western Asia and poverty level among seniors over the age of 75 in the United States with a correlation coefficient (R) of 0.349 and weighted average of 12.9%. Similarly, the statistical analysis conducted on geographies consisting of 320,172,645 people shows a significant positive correlation between the proportion of Immigrants from Honduras and poverty level among seniors over the age of 75 in the United States with a correlation coefficient (R) of 0.630 and weighted average of 15.7%, a difference of 21.5%.
Seniors Poverty Over the Age of 75 Correlation Summary
| Measurement | Immigrants from Western Asia | Immigrants from Honduras |
| Minimum | 5.6% | 2.1% |
| Maximum | 35.3% | 100.0% |
| Range | 29.7% | 97.9% |
| Mean | 15.7% | 23.7% |
| Median | 14.0% | 16.1% |
| Interquartile 25% (IQ1) | 10.9% | 14.2% |
| Interquartile 75% (IQ3) | 19.7% | 31.8% |
| Interquartile Range (IQR) | 8.8% | 17.6% |
| Standard Deviation (Sample) | 6.6% | 17.8% |
| Standard Deviation (Population) | 6.6% | 17.7% |
Similar Demographics by Seniors Poverty Over the Age of 75
Demographics Similar to Immigrants from Western Asia by Seniors Poverty Over the Age of 75
In terms of seniors poverty over the age of 75, the demographic groups most similar to Immigrants from Western Asia are Bermudan (12.9%, a difference of 0.030%), Ute (12.9%, a difference of 0.060%), Immigrants from Brazil (12.9%, a difference of 0.12%), Seminole (12.9%, a difference of 0.17%), and South American Indian (12.9%, a difference of 0.24%).
| Demographics | Rating | Rank | Seniors Poverty Over the Age of 75 |
| Brazilians | 6.9 /100 | #211 | Tragic 12.8% |
| Immigrants | Hong Kong | 6.5 /100 | #212 | Tragic 12.8% |
| French American Indians | 6.1 /100 | #213 | Tragic 12.9% |
| Immigrants | Africa | 5.9 /100 | #214 | Tragic 12.9% |
| South American Indians | 5.5 /100 | #215 | Tragic 12.9% |
| Immigrants | Brazil | 5.2 /100 | #216 | Tragic 12.9% |
| Bermudans | 4.9 /100 | #217 | Tragic 12.9% |
| Immigrants | Western Asia | 4.9 /100 | #218 | Tragic 12.9% |
| Ute | 4.7 /100 | #219 | Tragic 12.9% |
| Seminole | 4.5 /100 | #220 | Tragic 12.9% |
| Immigrants | Kazakhstan | 4.3 /100 | #221 | Tragic 13.0% |
| Nigerians | 3.4 /100 | #222 | Tragic 13.0% |
| Immigrants | Nigeria | 3.3 /100 | #223 | Tragic 13.0% |
| Chippewa | 2.9 /100 | #224 | Tragic 13.1% |
| Immigrants | Morocco | 2.8 /100 | #225 | Tragic 13.1% |
Demographics Similar to Immigrants from Honduras by Seniors Poverty Over the Age of 75
In terms of seniors poverty over the age of 75, the demographic groups most similar to Immigrants from Honduras are West Indian (15.7%, a difference of 0.17%), Immigrants from Trinidad and Tobago (15.7%, a difference of 0.18%), Ecuadorian (15.7%, a difference of 0.22%), Hispanic or Latino (15.8%, a difference of 0.38%), and Immigrants from Latin America (15.6%, a difference of 0.48%).
| Demographics | Rating | Rank | Seniors Poverty Over the Age of 75 |
| Yuman | 0.0 /100 | #296 | Tragic 15.4% |
| Hondurans | 0.0 /100 | #297 | Tragic 15.4% |
| Natives/Alaskans | 0.0 /100 | #298 | Tragic 15.5% |
| Spanish American Indians | 0.0 /100 | #299 | Tragic 15.5% |
| Bahamians | 0.0 /100 | #300 | Tragic 15.5% |
| Immigrants | Latin America | 0.0 /100 | #301 | Tragic 15.6% |
| West Indians | 0.0 /100 | #302 | Tragic 15.7% |
| Immigrants | Honduras | 0.0 /100 | #303 | Tragic 15.7% |
| Immigrants | Trinidad and Tobago | 0.0 /100 | #304 | Tragic 15.7% |
| Ecuadorians | 0.0 /100 | #305 | Tragic 15.7% |
| Hispanics or Latinos | 0.0 /100 | #306 | Tragic 15.8% |
| Immigrants | West Indies | 0.0 /100 | #307 | Tragic 15.8% |
| Immigrants | Bangladesh | 0.0 /100 | #308 | Tragic 15.8% |
| Yup'ik | 0.0 /100 | #309 | Tragic 15.8% |
| Vietnamese | 0.0 /100 | #310 | Tragic 15.9% |