Immigrants from West Indies vs Immigrants from Portugal 10th Grade
COMPARE
Immigrants from West Indies
Immigrants from Portugal
10th Grade
10th Grade Comparison
Immigrants from West Indies
Immigrants from Portugal
91.8%
10TH GRADE
0.0/ 100
METRIC RATING
291st/ 347
METRIC RANK
90.8%
10TH GRADE
0.0/ 100
METRIC RATING
312th/ 347
METRIC RANK
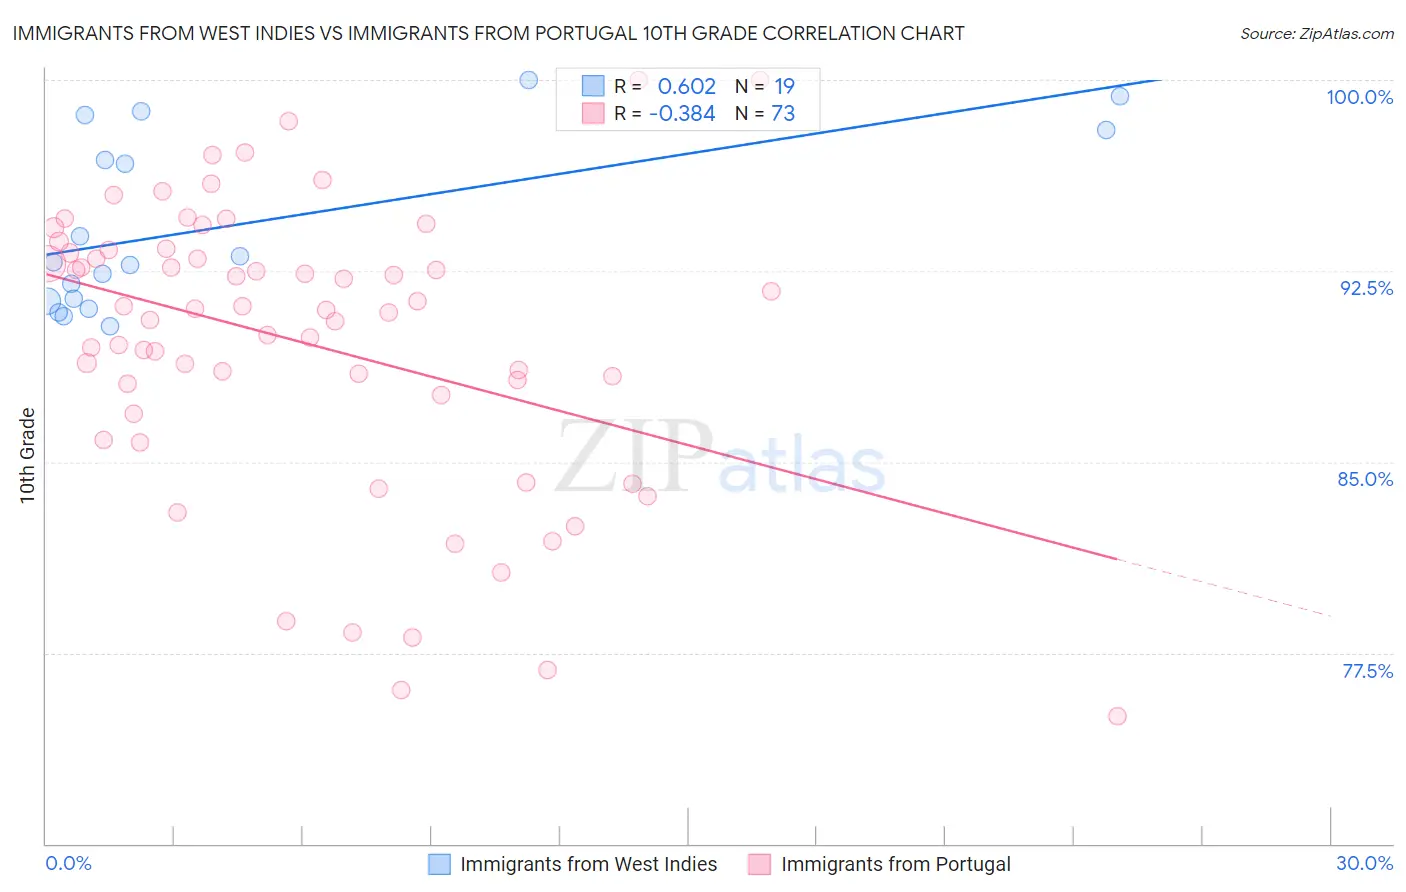
Immigrants from West Indies vs Immigrants from Portugal 10th Grade Correlation Chart
The statistical analysis conducted on geographies consisting of 72,457,514 people shows a significant positive correlation between the proportion of Immigrants from West Indies and percentage of population with at least 10th grade education in the United States with a correlation coefficient (R) of 0.602 and weighted average of 91.8%. Similarly, the statistical analysis conducted on geographies consisting of 174,792,107 people shows a mild negative correlation between the proportion of Immigrants from Portugal and percentage of population with at least 10th grade education in the United States with a correlation coefficient (R) of -0.384 and weighted average of 90.8%, a difference of 1.1%.
10th Grade Correlation Summary
| Measurement | Immigrants from West Indies | Immigrants from Portugal |
| Minimum | 90.4% | 75.0% |
| Maximum | 100.0% | 100.0% |
| Range | 9.6% | 25.0% |
| Mean | 94.3% | 89.7% |
| Median | 92.8% | 91.0% |
| Interquartile 25% (IQ1) | 91.3% | 87.3% |
| Interquartile 75% (IQ3) | 98.0% | 93.3% |
| Interquartile Range (IQR) | 6.7% | 6.0% |
| Standard Deviation (Sample) | 3.4% | 5.6% |
| Standard Deviation (Population) | 3.3% | 5.6% |
Similar Demographics by 10th Grade
Demographics Similar to Immigrants from West Indies by 10th Grade
In terms of 10th grade, the demographic groups most similar to Immigrants from West Indies are British West Indian (91.8%, a difference of 0.0%), Immigrants from Burma/Myanmar (91.8%, a difference of 0.0%), Indonesian (91.8%, a difference of 0.020%), Sri Lankan (91.8%, a difference of 0.030%), and Pennsylvania German (91.9%, a difference of 0.060%).
| Demographics | Rating | Rank | 10th Grade |
| Immigrants | Barbados | 0.0 /100 | #284 | Tragic 92.1% |
| Immigrants | South Eastern Asia | 0.0 /100 | #285 | Tragic 92.1% |
| Yuman | 0.0 /100 | #286 | Tragic 92.0% |
| Pennsylvania Germans | 0.0 /100 | #287 | Tragic 91.9% |
| Immigrants | Laos | 0.0 /100 | #288 | Tragic 91.9% |
| Sri Lankans | 0.0 /100 | #289 | Tragic 91.8% |
| British West Indians | 0.0 /100 | #290 | Tragic 91.8% |
| Immigrants | West Indies | 0.0 /100 | #291 | Tragic 91.8% |
| Immigrants | Burma/Myanmar | 0.0 /100 | #292 | Tragic 91.8% |
| Indonesians | 0.0 /100 | #293 | Tragic 91.8% |
| Haitians | 0.0 /100 | #294 | Tragic 91.8% |
| Lumbee | 0.0 /100 | #295 | Tragic 91.7% |
| Immigrants | Grenada | 0.0 /100 | #296 | Tragic 91.6% |
| Fijians | 0.0 /100 | #297 | Tragic 91.5% |
| Cubans | 0.0 /100 | #298 | Tragic 91.5% |
Demographics Similar to Immigrants from Portugal by 10th Grade
In terms of 10th grade, the demographic groups most similar to Immigrants from Portugal are Cape Verdean (90.8%, a difference of 0.030%), Nepalese (90.7%, a difference of 0.11%), Immigrants from Cambodia (90.9%, a difference of 0.16%), Vietnamese (90.9%, a difference of 0.19%), and Immigrants from Caribbean (90.6%, a difference of 0.19%).
| Demographics | Rating | Rank | 10th Grade |
| Immigrants | Dominica | 0.0 /100 | #305 | Tragic 91.1% |
| Yaqui | 0.0 /100 | #306 | Tragic 91.1% |
| Immigrants | Fiji | 0.0 /100 | #307 | Tragic 91.0% |
| Immigrants | Bangladesh | 0.0 /100 | #308 | Tragic 91.0% |
| Immigrants | Immigrants | 0.0 /100 | #309 | Tragic 91.0% |
| Vietnamese | 0.0 /100 | #310 | Tragic 90.9% |
| Immigrants | Cambodia | 0.0 /100 | #311 | Tragic 90.9% |
| Immigrants | Portugal | 0.0 /100 | #312 | Tragic 90.8% |
| Cape Verdeans | 0.0 /100 | #313 | Tragic 90.8% |
| Nepalese | 0.0 /100 | #314 | Tragic 90.7% |
| Immigrants | Caribbean | 0.0 /100 | #315 | Tragic 90.6% |
| Ecuadorians | 0.0 /100 | #316 | Tragic 90.6% |
| Immigrants | Ecuador | 0.0 /100 | #317 | Tragic 90.4% |
| Immigrants | Cuba | 0.0 /100 | #318 | Tragic 90.2% |
| Nicaraguans | 0.0 /100 | #319 | Tragic 90.2% |