Immigrants from Venezuela vs Navajo Receiving Food Stamps
COMPARE
Immigrants from Venezuela
Navajo
Receiving Food Stamps
Receiving Food Stamps Comparison
Immigrants from Venezuela
Navajo
12.3%
RECEIVING FOOD STAMPS
20.1/ 100
METRIC RATING
202nd/ 347
METRIC RANK
21.1%
RECEIVING FOOD STAMPS
0.0/ 100
METRIC RATING
336th/ 347
METRIC RANK
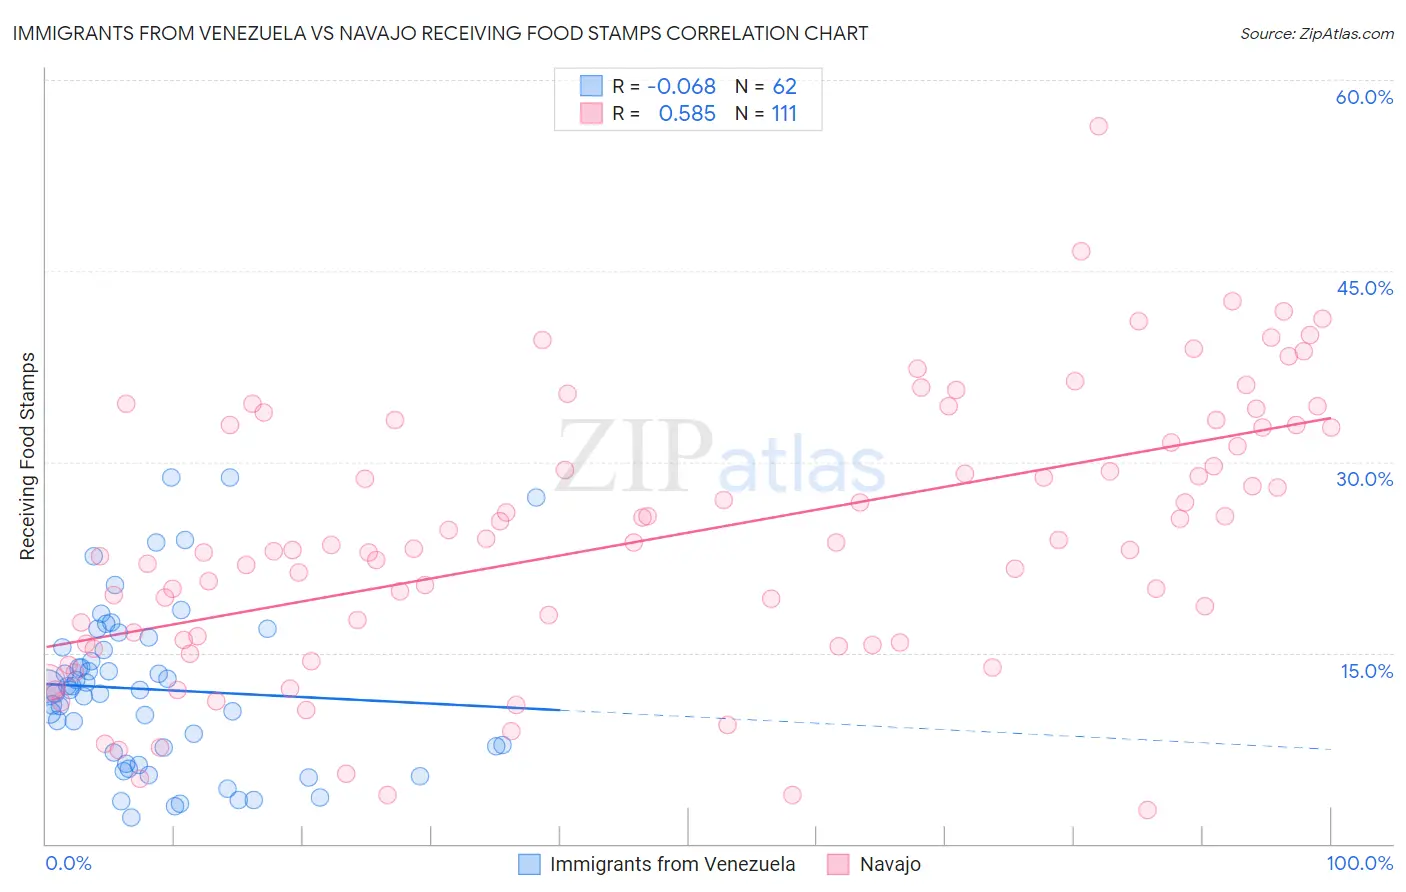
Immigrants from Venezuela vs Navajo Receiving Food Stamps Correlation Chart
The statistical analysis conducted on geographies consisting of 287,368,478 people shows a slight negative correlation between the proportion of Immigrants from Venezuela and percentage of population receiving government assistance and/or food stamps in the United States with a correlation coefficient (R) of -0.068 and weighted average of 12.3%. Similarly, the statistical analysis conducted on geographies consisting of 224,653,325 people shows a substantial positive correlation between the proportion of Navajo and percentage of population receiving government assistance and/or food stamps in the United States with a correlation coefficient (R) of 0.585 and weighted average of 21.1%, a difference of 71.1%.
Receiving Food Stamps Correlation Summary
| Measurement | Immigrants from Venezuela | Navajo |
| Minimum | 2.1% | 2.7% |
| Maximum | 28.8% | 56.3% |
| Range | 26.7% | 53.6% |
| Mean | 12.1% | 24.1% |
| Median | 12.1% | 23.5% |
| Interquartile 25% (IQ1) | 7.2% | 15.8% |
| Interquartile 75% (IQ3) | 15.5% | 32.9% |
| Interquartile Range (IQR) | 8.3% | 17.1% |
| Standard Deviation (Sample) | 6.4% | 10.6% |
| Standard Deviation (Population) | 6.4% | 10.6% |
Similar Demographics by Receiving Food Stamps
Demographics Similar to Immigrants from Venezuela by Receiving Food Stamps
In terms of receiving food stamps, the demographic groups most similar to Immigrants from Venezuela are Ugandan (12.2%, a difference of 0.48%), Shoshone (12.4%, a difference of 0.53%), Nonimmigrants (12.4%, a difference of 0.56%), Aleut (12.4%, a difference of 0.62%), and Sierra Leonean (12.2%, a difference of 0.68%).
| Demographics | Rating | Rank | Receiving Food Stamps |
| Americans | 26.7 /100 | #195 | Fair 12.2% |
| Iraqis | 26.6 /100 | #196 | Fair 12.2% |
| Delaware | 26.1 /100 | #197 | Fair 12.2% |
| Immigrants | Costa Rica | 25.4 /100 | #198 | Fair 12.2% |
| Portuguese | 25.1 /100 | #199 | Fair 12.2% |
| Sierra Leoneans | 23.6 /100 | #200 | Fair 12.2% |
| Ugandans | 22.5 /100 | #201 | Fair 12.2% |
| Immigrants | Venezuela | 20.1 /100 | #202 | Fair 12.3% |
| Shoshone | 17.7 /100 | #203 | Poor 12.4% |
| Immigrants | Nonimmigrants | 17.6 /100 | #204 | Poor 12.4% |
| Aleuts | 17.3 /100 | #205 | Poor 12.4% |
| Immigrants | Thailand | 17.0 /100 | #206 | Poor 12.4% |
| South Americans | 16.0 /100 | #207 | Poor 12.4% |
| Potawatomi | 14.6 /100 | #208 | Poor 12.5% |
| Immigrants | Sierra Leone | 12.9 /100 | #209 | Poor 12.5% |
Demographics Similar to Navajo by Receiving Food Stamps
In terms of receiving food stamps, the demographic groups most similar to Navajo are Cape Verdean (21.1%, a difference of 0.060%), Immigrants from Cuba (20.8%, a difference of 1.1%), Dominican (21.4%, a difference of 1.5%), Yakama (21.4%, a difference of 1.7%), and Tohono O'odham (21.5%, a difference of 2.0%).
| Demographics | Rating | Rank | Receiving Food Stamps |
| Immigrants | Dominica | 0.0 /100 | #329 | Tragic 18.4% |
| Pima | 0.0 /100 | #330 | Tragic 19.0% |
| Immigrants | Caribbean | 0.0 /100 | #331 | Tragic 19.6% |
| Pueblo | 0.0 /100 | #332 | Tragic 19.9% |
| Inupiat | 0.0 /100 | #333 | Tragic 20.1% |
| Yuman | 0.0 /100 | #334 | Tragic 20.2% |
| Immigrants | Cuba | 0.0 /100 | #335 | Tragic 20.8% |
| Navajo | 0.0 /100 | #336 | Tragic 21.1% |
| Cape Verdeans | 0.0 /100 | #337 | Tragic 21.1% |
| Dominicans | 0.0 /100 | #338 | Tragic 21.4% |
| Yakama | 0.0 /100 | #339 | Tragic 21.4% |
| Tohono O'odham | 0.0 /100 | #340 | Tragic 21.5% |
| Hopi | 0.0 /100 | #341 | Tragic 21.6% |
| Immigrants | Yemen | 0.0 /100 | #342 | Tragic 21.6% |
| Immigrants | Dominican Republic | 0.0 /100 | #343 | Tragic 22.1% |