Immigrants from Venezuela vs Hawaiian Receiving Food Stamps
COMPARE
Immigrants from Venezuela
Hawaiian
Receiving Food Stamps
Receiving Food Stamps Comparison
Immigrants from Venezuela
Hawaiians
12.3%
RECEIVING FOOD STAMPS
20.1/ 100
METRIC RATING
202nd/ 347
METRIC RANK
12.9%
RECEIVING FOOD STAMPS
5.4/ 100
METRIC RATING
218th/ 347
METRIC RANK
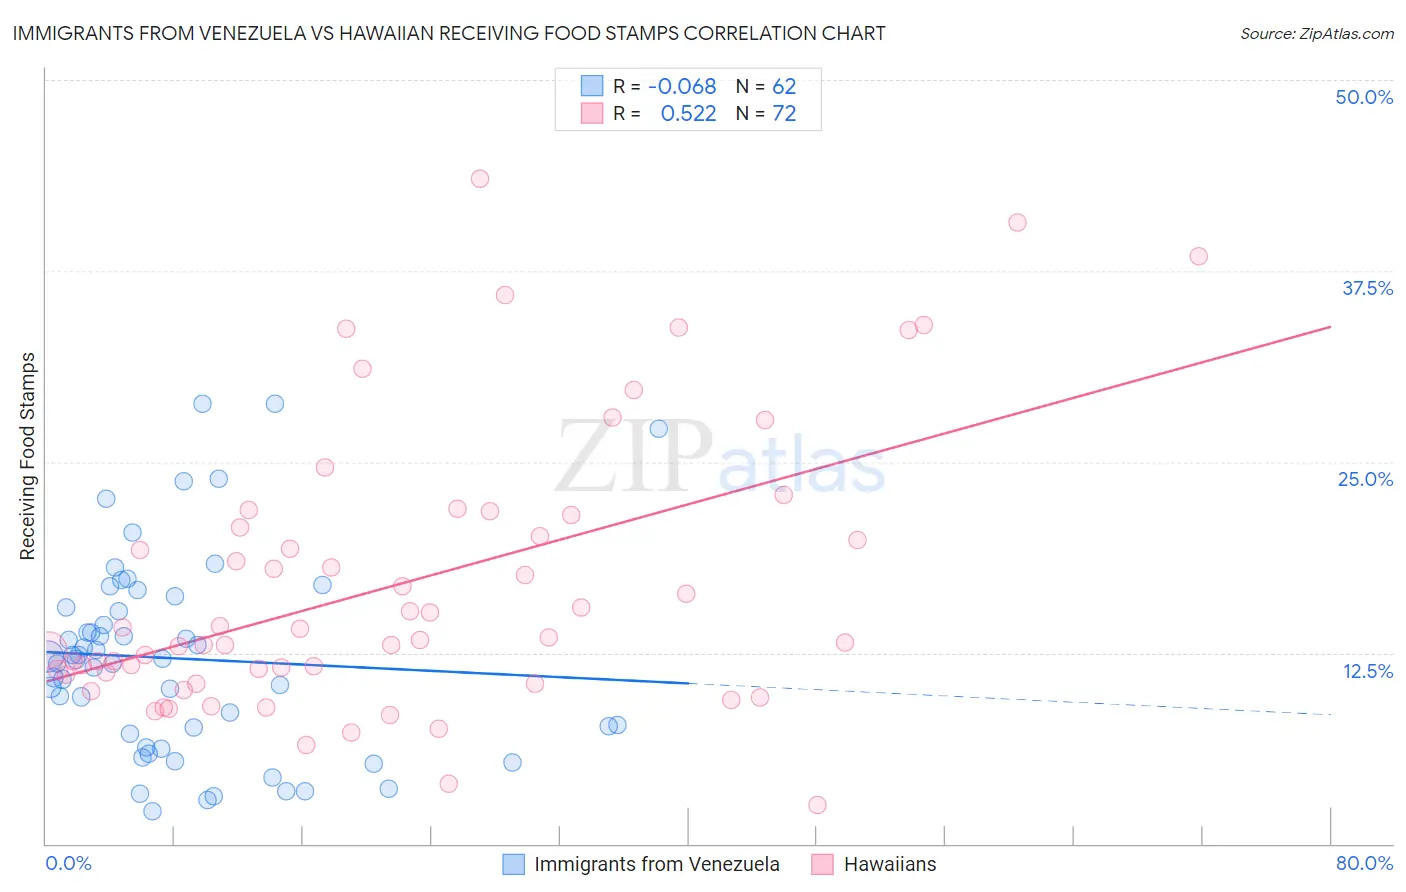
Immigrants from Venezuela vs Hawaiian Receiving Food Stamps Correlation Chart
The statistical analysis conducted on geographies consisting of 287,368,478 people shows a slight negative correlation between the proportion of Immigrants from Venezuela and percentage of population receiving government assistance and/or food stamps in the United States with a correlation coefficient (R) of -0.068 and weighted average of 12.3%. Similarly, the statistical analysis conducted on geographies consisting of 327,058,596 people shows a substantial positive correlation between the proportion of Hawaiians and percentage of population receiving government assistance and/or food stamps in the United States with a correlation coefficient (R) of 0.522 and weighted average of 12.9%, a difference of 5.0%.
Receiving Food Stamps Correlation Summary
| Measurement | Immigrants from Venezuela | Hawaiian |
| Minimum | 2.1% | 2.5% |
| Maximum | 28.8% | 43.5% |
| Range | 26.7% | 41.0% |
| Mean | 12.1% | 17.0% |
| Median | 12.1% | 13.4% |
| Interquartile 25% (IQ1) | 7.2% | 11.1% |
| Interquartile 75% (IQ3) | 15.5% | 21.1% |
| Interquartile Range (IQR) | 8.3% | 10.0% |
| Standard Deviation (Sample) | 6.4% | 9.1% |
| Standard Deviation (Population) | 6.4% | 9.1% |
Demographics Similar to Immigrants from Venezuela and Hawaiians by Receiving Food Stamps
In terms of receiving food stamps, the demographic groups most similar to Immigrants from Venezuela are Ugandan (12.2%, a difference of 0.48%), Shoshone (12.4%, a difference of 0.53%), Nonimmigrants (12.4%, a difference of 0.56%), Aleut (12.4%, a difference of 0.62%), and Sierra Leonean (12.2%, a difference of 0.68%). Similarly, the demographic groups most similar to Hawaiians are Immigrants from Middle Africa (12.9%, a difference of 0.010%), Immigrants from Colombia (12.9%, a difference of 0.050%), Immigrants from Burma/Myanmar (12.9%, a difference of 0.37%), Immigrants from South America (12.8%, a difference of 0.63%), and Native Hawaiian (12.8%, a difference of 0.73%).
| Demographics | Rating | Rank | Receiving Food Stamps |
| Sierra Leoneans | 23.6 /100 | #200 | Fair 12.2% |
| Ugandans | 22.5 /100 | #201 | Fair 12.2% |
| Immigrants | Venezuela | 20.1 /100 | #202 | Fair 12.3% |
| Shoshone | 17.7 /100 | #203 | Poor 12.4% |
| Immigrants | Nonimmigrants | 17.6 /100 | #204 | Poor 12.4% |
| Aleuts | 17.3 /100 | #205 | Poor 12.4% |
| Immigrants | Thailand | 17.0 /100 | #206 | Poor 12.4% |
| South Americans | 16.0 /100 | #207 | Poor 12.4% |
| Potawatomi | 14.6 /100 | #208 | Poor 12.5% |
| Immigrants | Sierra Leone | 12.9 /100 | #209 | Poor 12.5% |
| Immigrants | Uruguay | 12.8 /100 | #210 | Poor 12.5% |
| Colombians | 10.2 /100 | #211 | Poor 12.6% |
| Malaysians | 8.5 /100 | #212 | Tragic 12.7% |
| Moroccans | 7.6 /100 | #213 | Tragic 12.8% |
| Immigrants | Africa | 7.6 /100 | #214 | Tragic 12.8% |
| Native Hawaiians | 6.7 /100 | #215 | Tragic 12.8% |
| Immigrants | South America | 6.5 /100 | #216 | Tragic 12.8% |
| Immigrants | Burma/Myanmar | 6.0 /100 | #217 | Tragic 12.9% |
| Hawaiians | 5.4 /100 | #218 | Tragic 12.9% |
| Immigrants | Middle Africa | 5.4 /100 | #219 | Tragic 12.9% |
| Immigrants | Colombia | 5.3 /100 | #220 | Tragic 12.9% |