Immigrants from Venezuela vs Navajo 3rd Grade
COMPARE
Immigrants from Venezuela
Navajo
3rd Grade
3rd Grade Comparison
Immigrants from Venezuela
Navajo
97.7%
3RD GRADE
44.4/ 100
METRIC RATING
181st/ 347
METRIC RANK
97.8%
3RD GRADE
50.0/ 100
METRIC RATING
174th/ 347
METRIC RANK
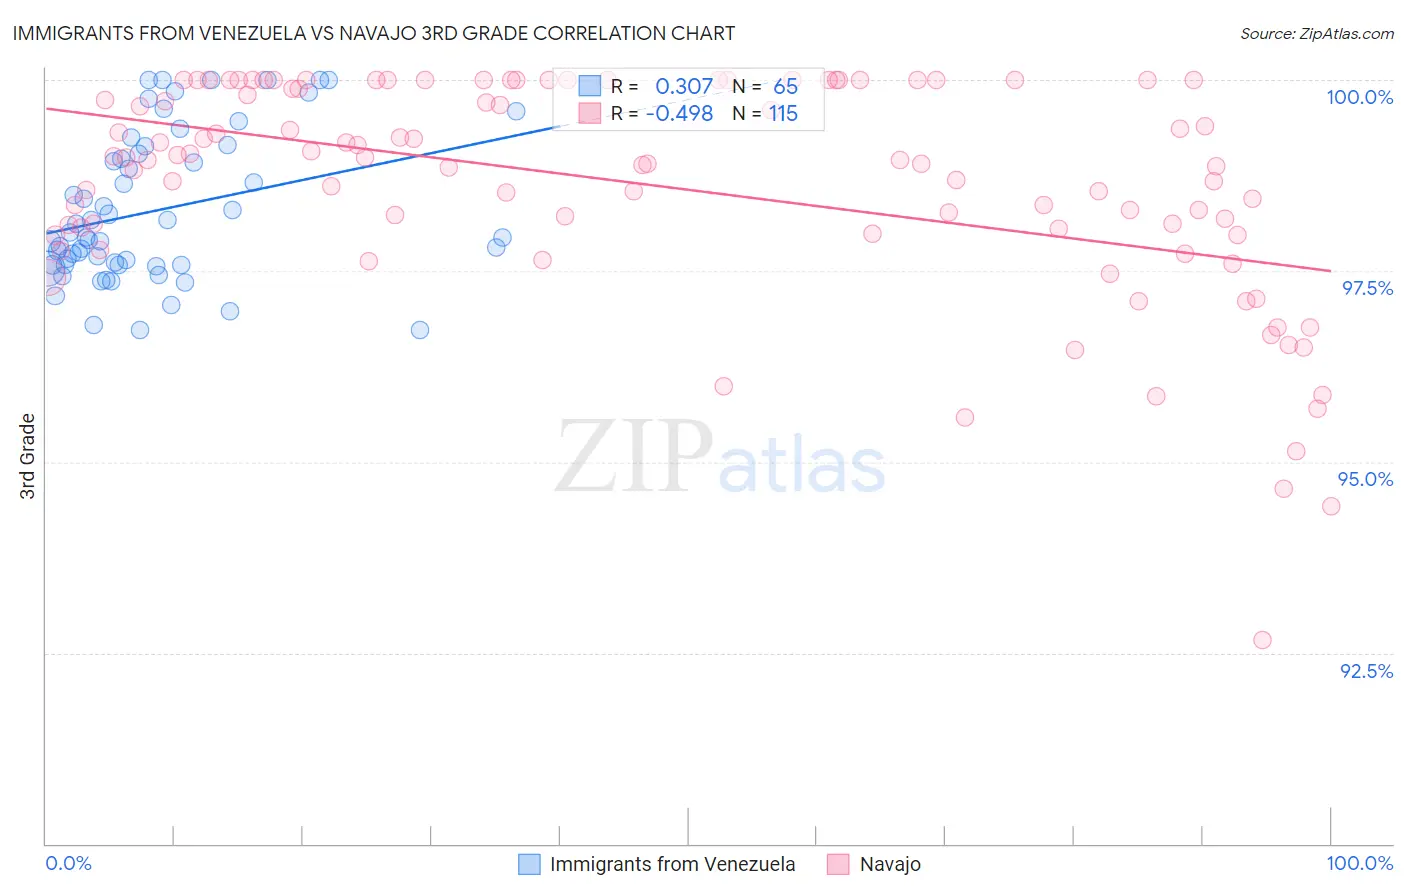
Immigrants from Venezuela vs Navajo 3rd Grade Correlation Chart
The statistical analysis conducted on geographies consisting of 287,866,009 people shows a mild positive correlation between the proportion of Immigrants from Venezuela and percentage of population with at least 3rd grade education in the United States with a correlation coefficient (R) of 0.307 and weighted average of 97.7%. Similarly, the statistical analysis conducted on geographies consisting of 224,872,493 people shows a moderate negative correlation between the proportion of Navajo and percentage of population with at least 3rd grade education in the United States with a correlation coefficient (R) of -0.498 and weighted average of 97.8%, a difference of 0.020%.
3rd Grade Correlation Summary
| Measurement | Immigrants from Venezuela | Navajo |
| Minimum | 96.7% | 92.7% |
| Maximum | 100.0% | 100.0% |
| Range | 3.3% | 7.3% |
| Mean | 98.3% | 98.6% |
| Median | 97.9% | 98.9% |
| Interquartile 25% (IQ1) | 97.6% | 98.0% |
| Interquartile 75% (IQ3) | 99.1% | 100.0% |
| Interquartile Range (IQR) | 1.5% | 2.0% |
| Standard Deviation (Sample) | 0.96% | 1.4% |
| Standard Deviation (Population) | 0.95% | 1.4% |
Demographics Similar to Immigrants from Venezuela and Navajo by 3rd Grade
In terms of 3rd grade, the demographic groups most similar to Immigrants from Venezuela are Immigrants from Sri Lanka (97.7%, a difference of 0.0%), Immigrants from Micronesia (97.8%, a difference of 0.010%), Immigrants from Poland (97.8%, a difference of 0.010%), Egyptian (97.7%, a difference of 0.010%), and Immigrants from Brazil (97.7%, a difference of 0.010%). Similarly, the demographic groups most similar to Navajo are Immigrants from Korea (97.8%, a difference of 0.0%), Immigrants from Spain (97.8%, a difference of 0.010%), Comanche (97.8%, a difference of 0.010%), Brazilian (97.8%, a difference of 0.010%), and Kenyan (97.8%, a difference of 0.010%).
| Demographics | Rating | Rank | 3rd Grade |
| Chileans | 55.3 /100 | #167 | Average 97.8% |
| Immigrants | Spain | 54.3 /100 | #168 | Average 97.8% |
| Comanche | 53.8 /100 | #169 | Average 97.8% |
| Brazilians | 53.7 /100 | #170 | Average 97.8% |
| Kenyans | 51.8 /100 | #171 | Average 97.8% |
| Spanish Americans | 51.8 /100 | #172 | Average 97.8% |
| Immigrants | Korea | 50.9 /100 | #173 | Average 97.8% |
| Navajo | 50.0 /100 | #174 | Average 97.8% |
| Immigrants | Micronesia | 47.6 /100 | #175 | Average 97.8% |
| Immigrants | Poland | 47.1 /100 | #176 | Average 97.8% |
| Egyptians | 46.6 /100 | #177 | Average 97.7% |
| Immigrants | Brazil | 46.4 /100 | #178 | Average 97.7% |
| Immigrants | Belarus | 45.9 /100 | #179 | Average 97.7% |
| Immigrants | Sri Lanka | 45.1 /100 | #180 | Average 97.7% |
| Immigrants | Venezuela | 44.4 /100 | #181 | Average 97.7% |
| Argentineans | 42.9 /100 | #182 | Average 97.7% |
| Arabs | 40.0 /100 | #183 | Fair 97.7% |
| Immigrants | Kazakhstan | 37.4 /100 | #184 | Fair 97.7% |
| Immigrants | Argentina | 37.0 /100 | #185 | Fair 97.7% |
| Portuguese | 36.2 /100 | #186 | Fair 97.7% |
| Natives/Alaskans | 35.2 /100 | #187 | Fair 97.7% |