Immigrants from Uzbekistan vs Slavic Single Mother Poverty
COMPARE
Immigrants from Uzbekistan
Slavic
Single Mother Poverty
Single Mother Poverty Comparison
Immigrants from Uzbekistan
Slavs
29.3%
SINGLE MOTHER POVERTY
42.6/ 100
METRIC RATING
179th/ 347
METRIC RANK
29.6%
SINGLE MOTHER POVERTY
24.5/ 100
METRIC RATING
195th/ 347
METRIC RANK
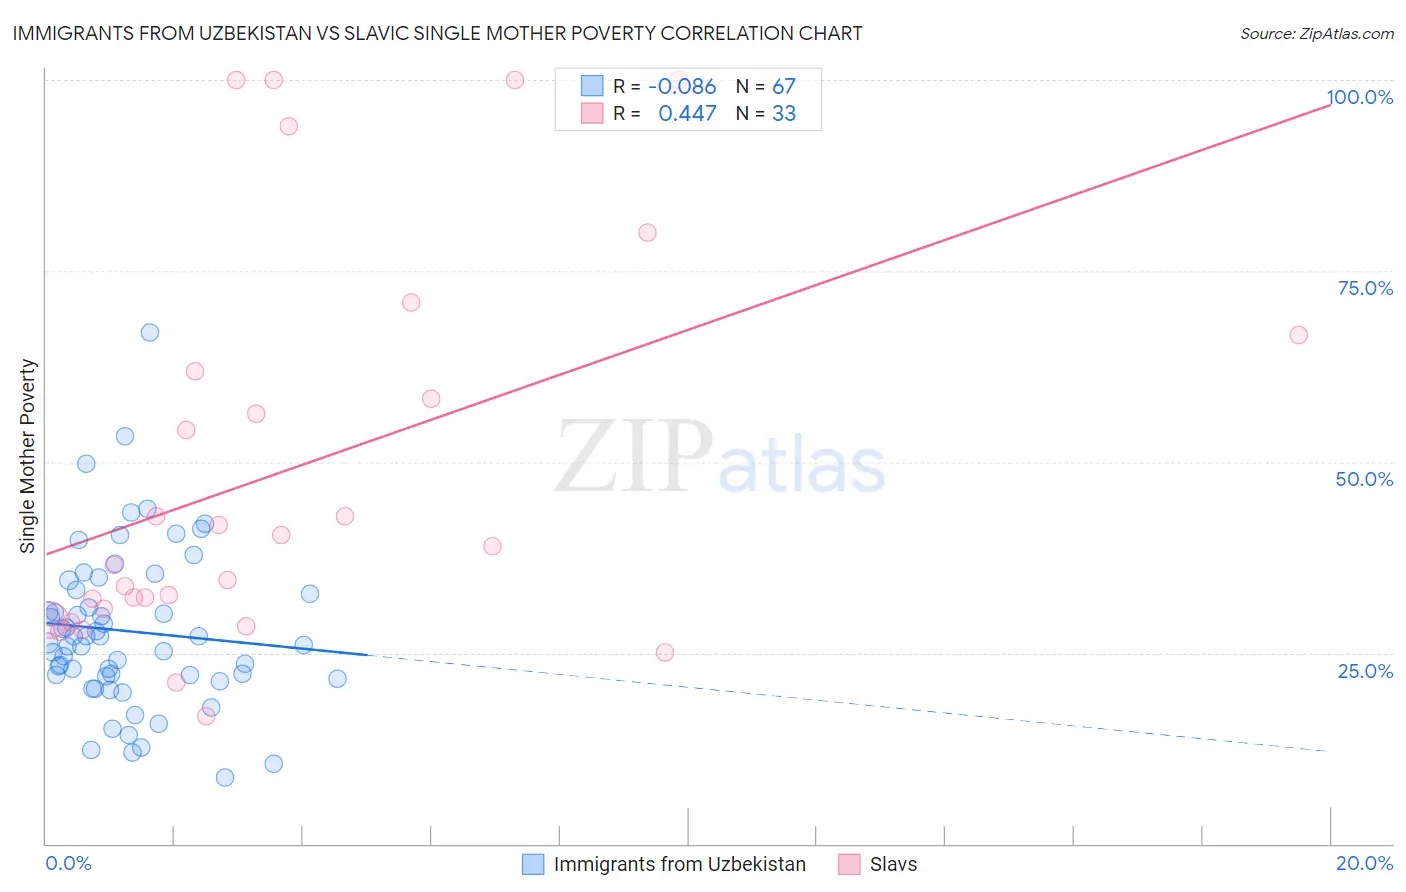
Immigrants from Uzbekistan vs Slavic Single Mother Poverty Correlation Chart
The statistical analysis conducted on geographies consisting of 117,476,483 people shows a slight negative correlation between the proportion of Immigrants from Uzbekistan and poverty level among single mothers in the United States with a correlation coefficient (R) of -0.086 and weighted average of 29.3%. Similarly, the statistical analysis conducted on geographies consisting of 265,304,000 people shows a moderate positive correlation between the proportion of Slavs and poverty level among single mothers in the United States with a correlation coefficient (R) of 0.447 and weighted average of 29.6%, a difference of 0.98%.
Single Mother Poverty Correlation Summary
| Measurement | Immigrants from Uzbekistan | Slavic |
| Minimum | 8.7% | 16.7% |
| Maximum | 67.0% | 100.0% |
| Range | 58.3% | 83.3% |
| Mean | 27.8% | 49.1% |
| Median | 26.3% | 38.9% |
| Interquartile 25% (IQ1) | 21.9% | 30.0% |
| Interquartile 75% (IQ3) | 33.2% | 64.3% |
| Interquartile Range (IQR) | 11.3% | 34.3% |
| Standard Deviation (Sample) | 10.5% | 25.8% |
| Standard Deviation (Population) | 10.4% | 25.4% |
Demographics Similar to Immigrants from Uzbekistan and Slavs by Single Mother Poverty
In terms of single mother poverty, the demographic groups most similar to Immigrants from Uzbekistan are South American Indian (29.3%, a difference of 0.030%), Immigrants from Norway (29.3%, a difference of 0.050%), Canadian (29.3%, a difference of 0.11%), Immigrants from Bosnia and Herzegovina (29.2%, a difference of 0.12%), and Immigrants from Eastern Africa (29.3%, a difference of 0.20%). Similarly, the demographic groups most similar to Slavs are Spanish American Indian (29.6%, a difference of 0.070%), Icelander (29.5%, a difference of 0.10%), Immigrants from Jamaica (29.6%, a difference of 0.17%), Basque (29.5%, a difference of 0.23%), and Moroccan (29.5%, a difference of 0.25%).
| Demographics | Rating | Rank | Single Mother Poverty |
| Immigrants | Bosnia and Herzegovina | 45.1 /100 | #177 | Average 29.2% |
| South American Indians | 43.2 /100 | #178 | Average 29.3% |
| Immigrants | Uzbekistan | 42.6 /100 | #179 | Average 29.3% |
| Immigrants | Norway | 41.5 /100 | #180 | Average 29.3% |
| Canadians | 40.4 /100 | #181 | Average 29.3% |
| Immigrants | Eastern Africa | 38.5 /100 | #182 | Fair 29.3% |
| Nepalese | 38.3 /100 | #183 | Fair 29.3% |
| Nigerians | 38.0 /100 | #184 | Fair 29.3% |
| Ghanaians | 36.8 /100 | #185 | Fair 29.4% |
| Yugoslavians | 36.0 /100 | #186 | Fair 29.4% |
| Lebanese | 32.5 /100 | #187 | Fair 29.4% |
| Guamanians/Chamorros | 31.8 /100 | #188 | Fair 29.4% |
| Immigrants | Africa | 31.6 /100 | #189 | Fair 29.4% |
| Immigrants | Germany | 30.4 /100 | #190 | Fair 29.5% |
| Immigrants | Trinidad and Tobago | 29.2 /100 | #191 | Fair 29.5% |
| Moroccans | 28.6 /100 | #192 | Fair 29.5% |
| Basques | 28.3 /100 | #193 | Fair 29.5% |
| Icelanders | 26.1 /100 | #194 | Fair 29.5% |
| Slavs | 24.5 /100 | #195 | Fair 29.6% |
| Spanish American Indians | 23.4 /100 | #196 | Fair 29.6% |
| Immigrants | Jamaica | 22.0 /100 | #197 | Fair 29.6% |