Immigrants from Uzbekistan vs Immigrants from Liberia In Labor Force | Age 25-29
COMPARE
Immigrants from Uzbekistan
Immigrants from Liberia
In Labor Force | Age 25-29
In Labor Force | Age 25-29 Comparison
Immigrants from Uzbekistan
Immigrants from Liberia
83.9%
IN LABOR FORCE | AGE 25-29
0.8/ 100
METRIC RATING
238th/ 347
METRIC RANK
85.9%
IN LABOR FORCE | AGE 25-29
100.0/ 100
METRIC RATING
29th/ 347
METRIC RANK
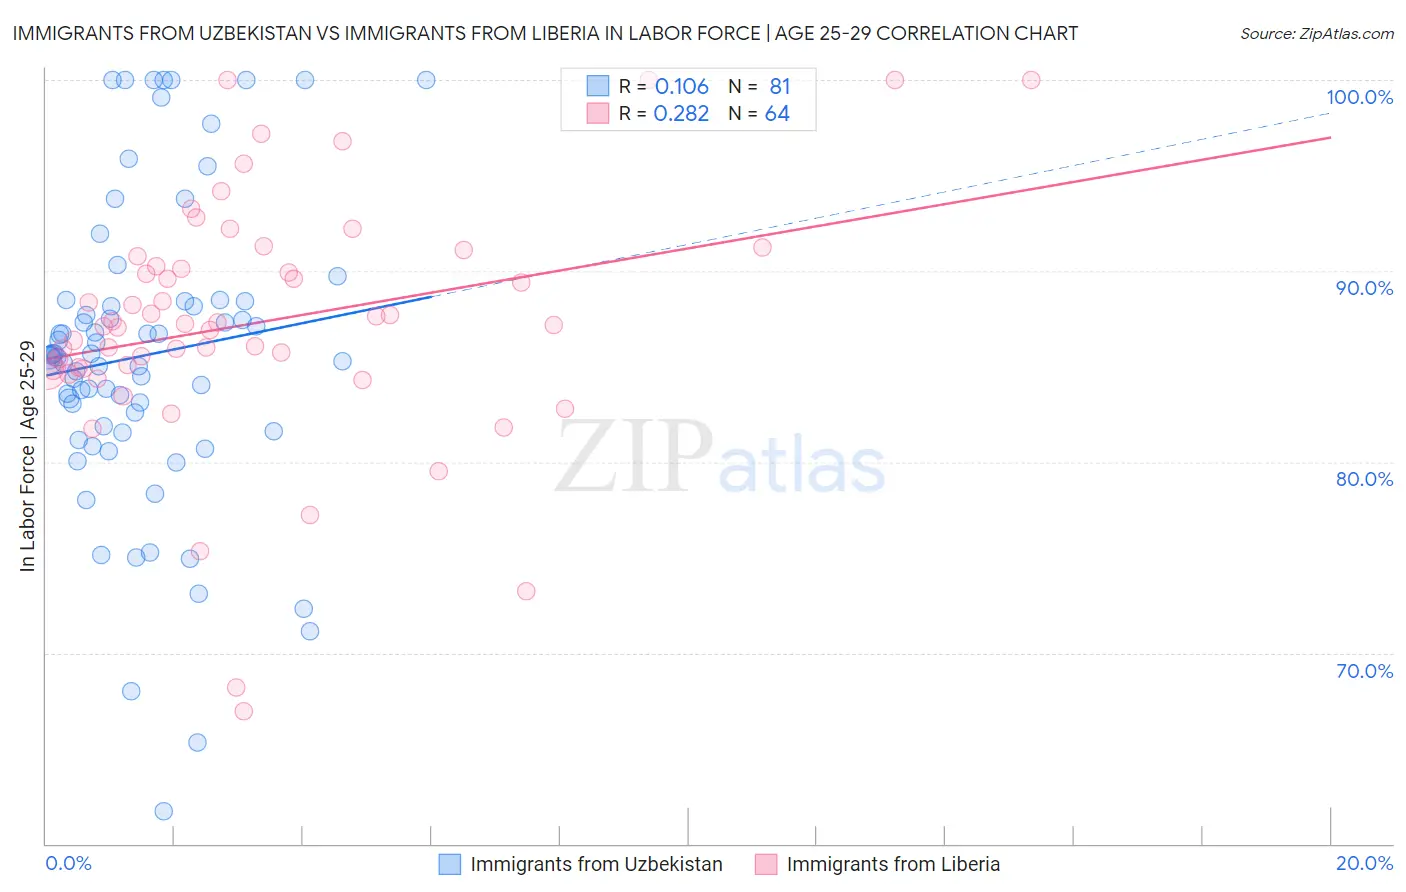
Immigrants from Uzbekistan vs Immigrants from Liberia In Labor Force | Age 25-29 Correlation Chart
The statistical analysis conducted on geographies consisting of 118,738,553 people shows a poor positive correlation between the proportion of Immigrants from Uzbekistan and labor force participation rate among population between the ages 25 and 29 in the United States with a correlation coefficient (R) of 0.106 and weighted average of 83.9%. Similarly, the statistical analysis conducted on geographies consisting of 135,263,214 people shows a weak positive correlation between the proportion of Immigrants from Liberia and labor force participation rate among population between the ages 25 and 29 in the United States with a correlation coefficient (R) of 0.282 and weighted average of 85.9%, a difference of 2.4%.
In Labor Force | Age 25-29 Correlation Summary
| Measurement | Immigrants from Uzbekistan | Immigrants from Liberia |
| Minimum | 61.7% | 66.9% |
| Maximum | 100.0% | 100.0% |
| Range | 38.3% | 33.1% |
| Mean | 85.6% | 87.3% |
| Median | 85.5% | 87.2% |
| Interquartile 25% (IQ1) | 81.7% | 84.9% |
| Interquartile 75% (IQ3) | 88.4% | 90.5% |
| Interquartile Range (IQR) | 6.7% | 5.6% |
| Standard Deviation (Sample) | 8.0% | 6.5% |
| Standard Deviation (Population) | 8.0% | 6.4% |
Similar Demographics by In Labor Force | Age 25-29
Demographics Similar to Immigrants from Uzbekistan by In Labor Force | Age 25-29
In terms of in labor force | age 25-29, the demographic groups most similar to Immigrants from Uzbekistan are Jamaican (83.9%, a difference of 0.0%), Trinidadian and Tobagonian (83.9%, a difference of 0.010%), Iraqi (83.9%, a difference of 0.030%), Guamanian/Chamorro (83.9%, a difference of 0.030%), and Immigrants (83.9%, a difference of 0.030%).
| Demographics | Rating | Rank | In Labor Force | Age 25-29 |
| Immigrants | Philippines | 4.7 /100 | #231 | Tragic 84.2% |
| Panamanians | 4.5 /100 | #232 | Tragic 84.2% |
| Immigrants | Western Asia | 2.7 /100 | #233 | Tragic 84.1% |
| Barbadians | 1.0 /100 | #234 | Tragic 83.9% |
| Iraqis | 0.9 /100 | #235 | Tragic 83.9% |
| Guamanians/Chamorros | 0.9 /100 | #236 | Tragic 83.9% |
| Immigrants | Immigrants | 0.9 /100 | #237 | Tragic 83.9% |
| Immigrants | Uzbekistan | 0.8 /100 | #238 | Tragic 83.9% |
| Jamaicans | 0.8 /100 | #239 | Tragic 83.9% |
| Trinidadians and Tobagonians | 0.7 /100 | #240 | Tragic 83.9% |
| Alsatians | 0.7 /100 | #241 | Tragic 83.9% |
| U.S. Virgin Islanders | 0.6 /100 | #242 | Tragic 83.8% |
| Salvadorans | 0.5 /100 | #243 | Tragic 83.8% |
| Immigrants | Jamaica | 0.4 /100 | #244 | Tragic 83.8% |
| Iroquois | 0.4 /100 | #245 | Tragic 83.8% |
Demographics Similar to Immigrants from Liberia by In Labor Force | Age 25-29
In terms of in labor force | age 25-29, the demographic groups most similar to Immigrants from Liberia are Ugandan (85.9%, a difference of 0.0%), Paraguayan (85.9%, a difference of 0.010%), Immigrants from North Macedonia (85.9%, a difference of 0.020%), Immigrants from Serbia (85.9%, a difference of 0.040%), and German Russian (85.8%, a difference of 0.050%).
| Demographics | Rating | Rank | In Labor Force | Age 25-29 |
| Cambodians | 100.0 /100 | #22 | Exceptional 86.0% |
| Immigrants | Uganda | 100.0 /100 | #23 | Exceptional 86.0% |
| Immigrants | Eastern Africa | 100.0 /100 | #24 | Exceptional 86.0% |
| Sudanese | 100.0 /100 | #25 | Exceptional 85.9% |
| Immigrants | North Macedonia | 100.0 /100 | #26 | Exceptional 85.9% |
| Paraguayans | 100.0 /100 | #27 | Exceptional 85.9% |
| Ugandans | 100.0 /100 | #28 | Exceptional 85.9% |
| Immigrants | Liberia | 100.0 /100 | #29 | Exceptional 85.9% |
| Immigrants | Serbia | 100.0 /100 | #30 | Exceptional 85.9% |
| German Russians | 100.0 /100 | #31 | Exceptional 85.8% |
| Slovaks | 100.0 /100 | #32 | Exceptional 85.8% |
| Immigrants | Bulgaria | 100.0 /100 | #33 | Exceptional 85.8% |
| Lithuanians | 99.9 /100 | #34 | Exceptional 85.8% |
| Cypriots | 99.9 /100 | #35 | Exceptional 85.8% |
| Immigrants | Nepal | 99.9 /100 | #36 | Exceptional 85.8% |