Immigrants from Uzbekistan vs Immigrants from Liberia 11th Grade
COMPARE
Immigrants from Uzbekistan
Immigrants from Liberia
11th Grade
11th Grade Comparison
Immigrants from Uzbekistan
Immigrants from Liberia
91.5%
11TH GRADE
1.0/ 100
METRIC RATING
248th/ 347
METRIC RANK
91.9%
11TH GRADE
7.0/ 100
METRIC RATING
221st/ 347
METRIC RANK
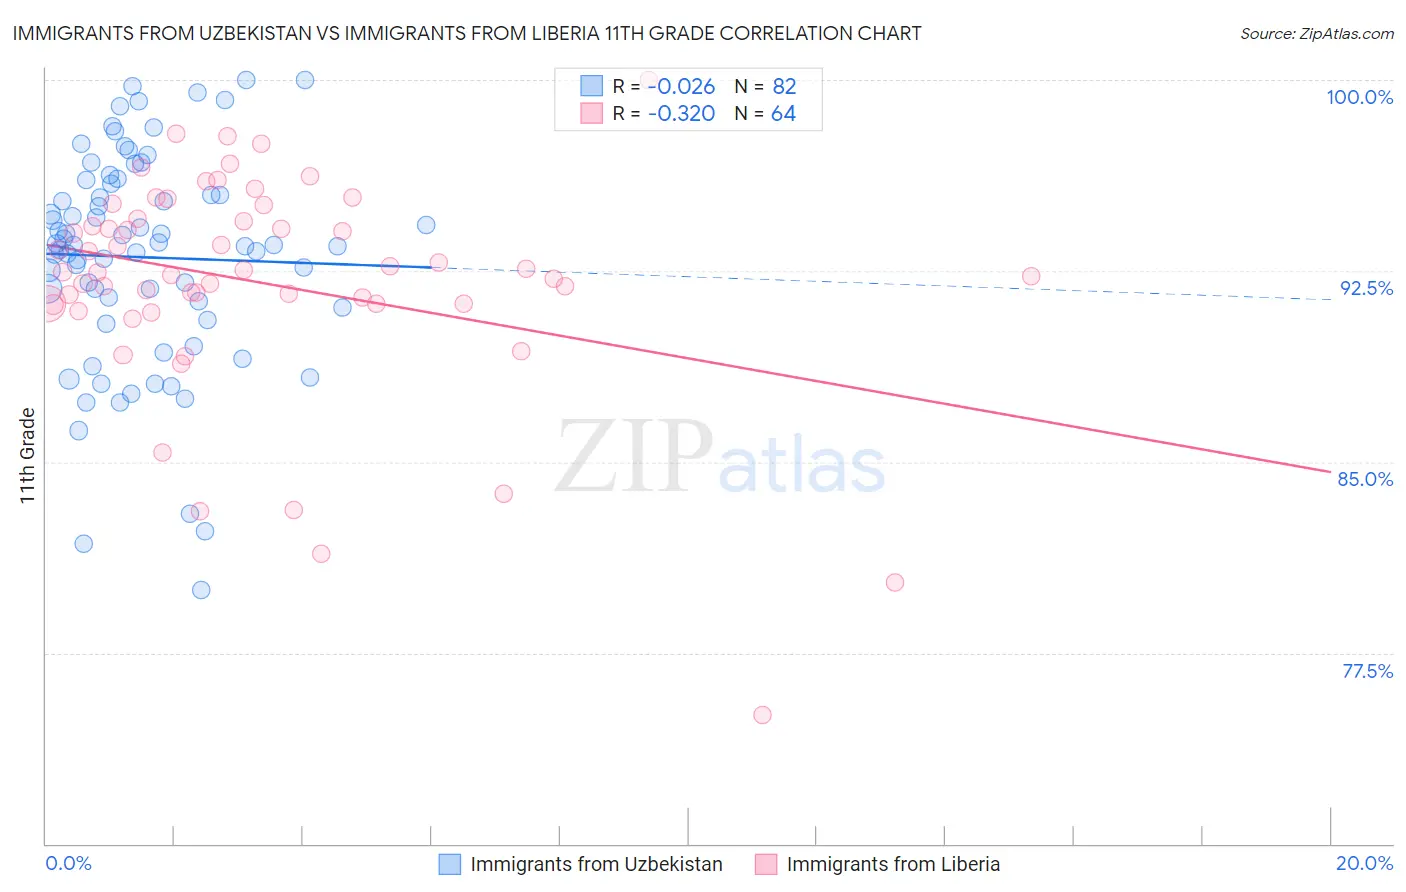
Immigrants from Uzbekistan vs Immigrants from Liberia 11th Grade Correlation Chart
The statistical analysis conducted on geographies consisting of 118,684,730 people shows no correlation between the proportion of Immigrants from Uzbekistan and percentage of population with at least 11th grade education in the United States with a correlation coefficient (R) of -0.026 and weighted average of 91.5%. Similarly, the statistical analysis conducted on geographies consisting of 135,293,967 people shows a mild negative correlation between the proportion of Immigrants from Liberia and percentage of population with at least 11th grade education in the United States with a correlation coefficient (R) of -0.320 and weighted average of 91.9%, a difference of 0.51%.
11th Grade Correlation Summary
| Measurement | Immigrants from Uzbekistan | Immigrants from Liberia |
| Minimum | 80.0% | 75.1% |
| Maximum | 100.0% | 100.0% |
| Range | 20.0% | 24.9% |
| Mean | 93.0% | 92.0% |
| Median | 93.5% | 92.4% |
| Interquartile 25% (IQ1) | 91.1% | 91.2% |
| Interquartile 75% (IQ3) | 95.9% | 94.5% |
| Interquartile Range (IQR) | 4.9% | 3.3% |
| Standard Deviation (Sample) | 4.3% | 4.4% |
| Standard Deviation (Population) | 4.2% | 4.4% |
Similar Demographics by 11th Grade
Demographics Similar to Immigrants from Uzbekistan by 11th Grade
In terms of 11th grade, the demographic groups most similar to Immigrants from Uzbekistan are Immigrants from Philippines (91.5%, a difference of 0.0%), Peruvian (91.5%, a difference of 0.0%), Ghanaian (91.5%, a difference of 0.010%), Immigrants from Costa Rica (91.4%, a difference of 0.030%), and Seminole (91.5%, a difference of 0.040%).
| Demographics | Rating | Rank | 11th Grade |
| Bahamians | 1.8 /100 | #241 | Tragic 91.6% |
| Immigrants | Middle Africa | 1.6 /100 | #242 | Tragic 91.6% |
| Immigrants | Thailand | 1.4 /100 | #243 | Tragic 91.6% |
| Senegalese | 1.4 /100 | #244 | Tragic 91.6% |
| Africans | 1.3 /100 | #245 | Tragic 91.5% |
| Seminole | 1.2 /100 | #246 | Tragic 91.5% |
| Immigrants | Philippines | 1.0 /100 | #247 | Tragic 91.5% |
| Immigrants | Uzbekistan | 1.0 /100 | #248 | Tragic 91.5% |
| Peruvians | 1.0 /100 | #249 | Tragic 91.5% |
| Ghanaians | 0.9 /100 | #250 | Tragic 91.5% |
| Immigrants | Costa Rica | 0.9 /100 | #251 | Tragic 91.4% |
| Immigrants | Nigeria | 0.8 /100 | #252 | Tragic 91.4% |
| Immigrants | South America | 0.8 /100 | #253 | Tragic 91.4% |
| Immigrants | Eritrea | 0.7 /100 | #254 | Tragic 91.4% |
| Blacks/African Americans | 0.7 /100 | #255 | Tragic 91.4% |
Demographics Similar to Immigrants from Liberia by 11th Grade
In terms of 11th grade, the demographic groups most similar to Immigrants from Liberia are South American Indian (92.0%, a difference of 0.020%), Immigrants from Africa (91.9%, a difference of 0.020%), Immigrants from Bahamas (91.9%, a difference of 0.020%), Costa Rican (91.9%, a difference of 0.030%), and Immigrants from Zaire (91.9%, a difference of 0.070%).
| Demographics | Rating | Rank | 11th Grade |
| Afghans | 12.8 /100 | #214 | Poor 92.1% |
| Immigrants | Southern Europe | 12.5 /100 | #215 | Poor 92.1% |
| Somalis | 11.6 /100 | #216 | Poor 92.1% |
| Immigrants | Sierra Leone | 11.1 /100 | #217 | Poor 92.0% |
| Blackfeet | 10.1 /100 | #218 | Poor 92.0% |
| Portuguese | 10.0 /100 | #219 | Tragic 92.0% |
| South American Indians | 7.6 /100 | #220 | Tragic 92.0% |
| Immigrants | Liberia | 7.0 /100 | #221 | Tragic 91.9% |
| Immigrants | Africa | 6.5 /100 | #222 | Tragic 91.9% |
| Immigrants | Bahamas | 6.5 /100 | #223 | Tragic 91.9% |
| Costa Ricans | 6.3 /100 | #224 | Tragic 91.9% |
| Immigrants | Zaire | 5.4 /100 | #225 | Tragic 91.9% |
| Immigrants | Somalia | 5.2 /100 | #226 | Tragic 91.9% |
| Immigrants | Cameroon | 4.4 /100 | #227 | Tragic 91.8% |
| Immigrants | Panama | 4.3 /100 | #228 | Tragic 91.8% |