Immigrants from Uzbekistan vs Greek Child Poverty Among Girls Under 16
COMPARE
Immigrants from Uzbekistan
Greek
Child Poverty Among Girls Under 16
Child Poverty Among Girls Under 16 Comparison
Immigrants from Uzbekistan
Greeks
17.1%
CHILD POVERTY AMONG GIRLS UNDER 16
21.5/ 100
METRIC RATING
200th/ 347
METRIC RANK
14.2%
CHILD POVERTY AMONG GIRLS UNDER 16
99.2/ 100
METRIC RATING
49th/ 347
METRIC RANK
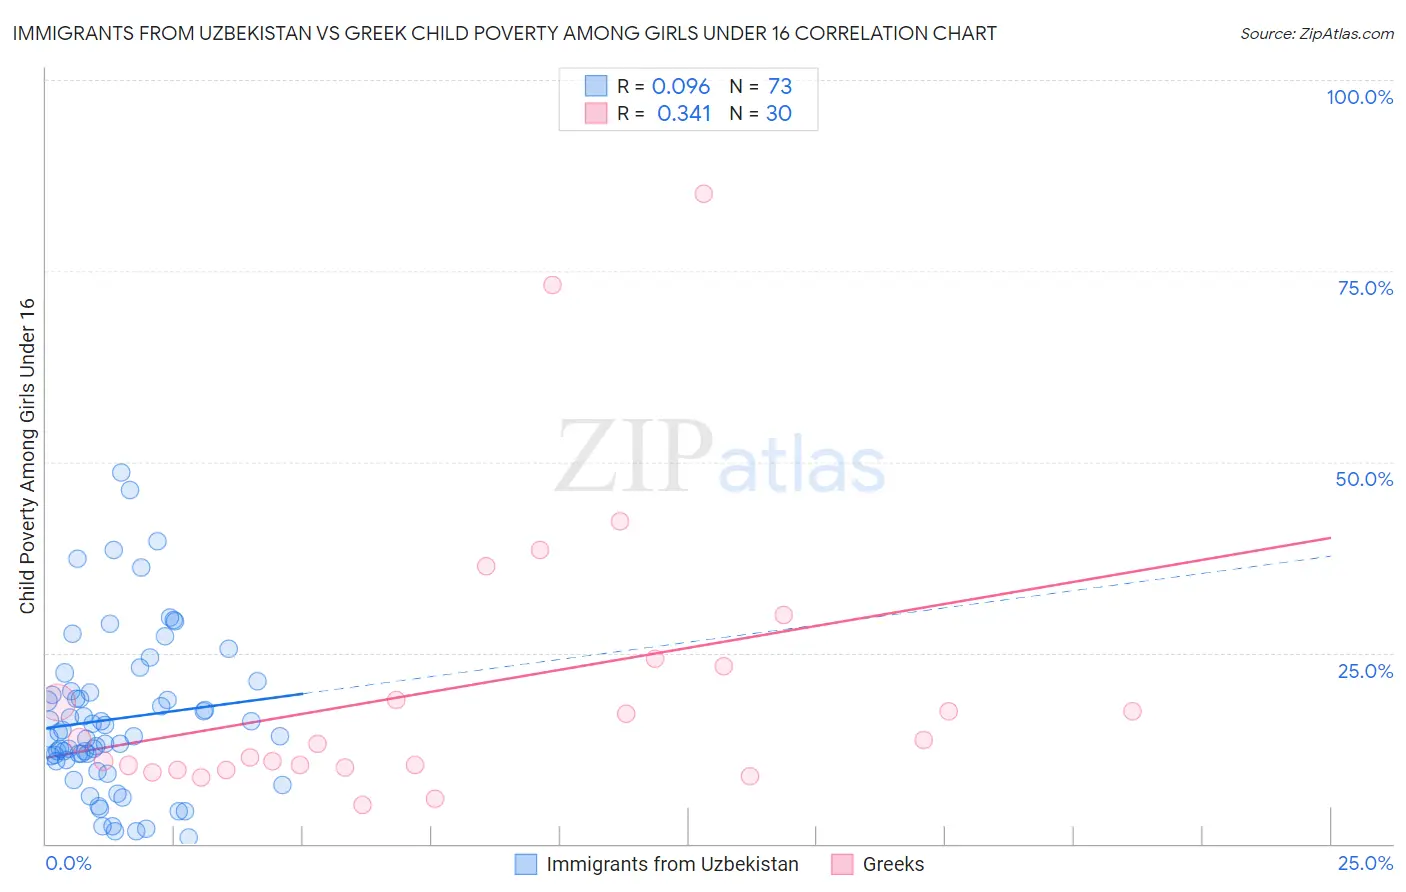
Immigrants from Uzbekistan vs Greek Child Poverty Among Girls Under 16 Correlation Chart
The statistical analysis conducted on geographies consisting of 117,883,123 people shows a slight positive correlation between the proportion of Immigrants from Uzbekistan and poverty level among girls under the age of 16 in the United States with a correlation coefficient (R) of 0.096 and weighted average of 17.1%. Similarly, the statistical analysis conducted on geographies consisting of 468,807,341 people shows a mild positive correlation between the proportion of Greeks and poverty level among girls under the age of 16 in the United States with a correlation coefficient (R) of 0.341 and weighted average of 14.2%, a difference of 20.7%.
Child Poverty Among Girls Under 16 Correlation Summary
| Measurement | Immigrants from Uzbekistan | Greek |
| Minimum | 0.85% | 5.0% |
| Maximum | 48.6% | 85.1% |
| Range | 47.8% | 80.1% |
| Mean | 16.4% | 20.4% |
| Median | 14.1% | 13.3% |
| Interquartile 25% (IQ1) | 10.9% | 10.0% |
| Interquartile 75% (IQ3) | 19.8% | 23.2% |
| Interquartile Range (IQR) | 8.9% | 13.2% |
| Standard Deviation (Sample) | 10.4% | 18.6% |
| Standard Deviation (Population) | 10.3% | 18.3% |
Similar Demographics by Child Poverty Among Girls Under 16
Demographics Similar to Immigrants from Uzbekistan by Child Poverty Among Girls Under 16
In terms of child poverty among girls under 16, the demographic groups most similar to Immigrants from Uzbekistan are Immigrants from Afghanistan (17.1%, a difference of 0.16%), Immigrants from Lebanon (17.1%, a difference of 0.18%), Spaniard (17.0%, a difference of 0.53%), Celtic (17.0%, a difference of 0.59%), and Immigrants from Costa Rica (17.0%, a difference of 0.64%).
| Demographics | Rating | Rank | Child Poverty Among Girls Under 16 |
| Aleuts | 28.7 /100 | #193 | Fair 16.9% |
| Spanish | 28.6 /100 | #194 | Fair 16.9% |
| Immigrants | Costa Rica | 25.6 /100 | #195 | Fair 17.0% |
| Celtics | 25.2 /100 | #196 | Fair 17.0% |
| Spaniards | 24.9 /100 | #197 | Fair 17.0% |
| Immigrants | Lebanon | 22.6 /100 | #198 | Fair 17.1% |
| Immigrants | Afghanistan | 22.4 /100 | #199 | Fair 17.1% |
| Immigrants | Uzbekistan | 21.5 /100 | #200 | Fair 17.1% |
| Immigrants | Kenya | 17.8 /100 | #201 | Poor 17.2% |
| Immigrants | Sierra Leone | 17.6 /100 | #202 | Poor 17.2% |
| Ugandans | 17.5 /100 | #203 | Poor 17.2% |
| Iraqis | 13.0 /100 | #204 | Poor 17.4% |
| Immigrants | Cameroon | 12.6 /100 | #205 | Poor 17.4% |
| Delaware | 11.5 /100 | #206 | Poor 17.4% |
| Hmong | 10.6 /100 | #207 | Poor 17.5% |
Demographics Similar to Greeks by Child Poverty Among Girls Under 16
In terms of child poverty among girls under 16, the demographic groups most similar to Greeks are Czech (14.2%, a difference of 0.040%), Immigrants from Czechoslovakia (14.2%, a difference of 0.060%), Immigrants from Israel (14.2%, a difference of 0.070%), Croatian (14.1%, a difference of 0.080%), and Immigrants from Greece (14.1%, a difference of 0.11%).
| Demographics | Rating | Rank | Child Poverty Among Girls Under 16 |
| Immigrants | Scotland | 99.4 /100 | #42 | Exceptional 14.0% |
| Koreans | 99.4 /100 | #43 | Exceptional 14.1% |
| Immigrants | Asia | 99.4 /100 | #44 | Exceptional 14.1% |
| Immigrants | Greece | 99.3 /100 | #45 | Exceptional 14.1% |
| Croatians | 99.3 /100 | #46 | Exceptional 14.1% |
| Immigrants | Czechoslovakia | 99.3 /100 | #47 | Exceptional 14.2% |
| Czechs | 99.3 /100 | #48 | Exceptional 14.2% |
| Greeks | 99.2 /100 | #49 | Exceptional 14.2% |
| Immigrants | Israel | 99.2 /100 | #50 | Exceptional 14.2% |
| Immigrants | Pakistan | 99.1 /100 | #51 | Exceptional 14.2% |
| Italians | 99.1 /100 | #52 | Exceptional 14.3% |
| Luxembourgers | 99.0 /100 | #53 | Exceptional 14.3% |
| Estonians | 98.9 /100 | #54 | Exceptional 14.3% |
| Immigrants | Romania | 98.9 /100 | #55 | Exceptional 14.3% |
| Immigrants | Indonesia | 98.9 /100 | #56 | Exceptional 14.4% |