Immigrants from Uzbekistan vs Greek Unemployment Among Ages 45 to 54 years
COMPARE
Immigrants from Uzbekistan
Greek
Unemployment Among Ages 45 to 54 years
Unemployment Among Ages 45 to 54 years Comparison
Immigrants from Uzbekistan
Greeks
4.9%
UNEMPLOYMENT AMONG AGES 45 TO 54 YEARS
0.0/ 100
METRIC RATING
268th/ 347
METRIC RANK
4.3%
UNEMPLOYMENT AMONG AGES 45 TO 54 YEARS
99.3/ 100
METRIC RATING
58th/ 347
METRIC RANK
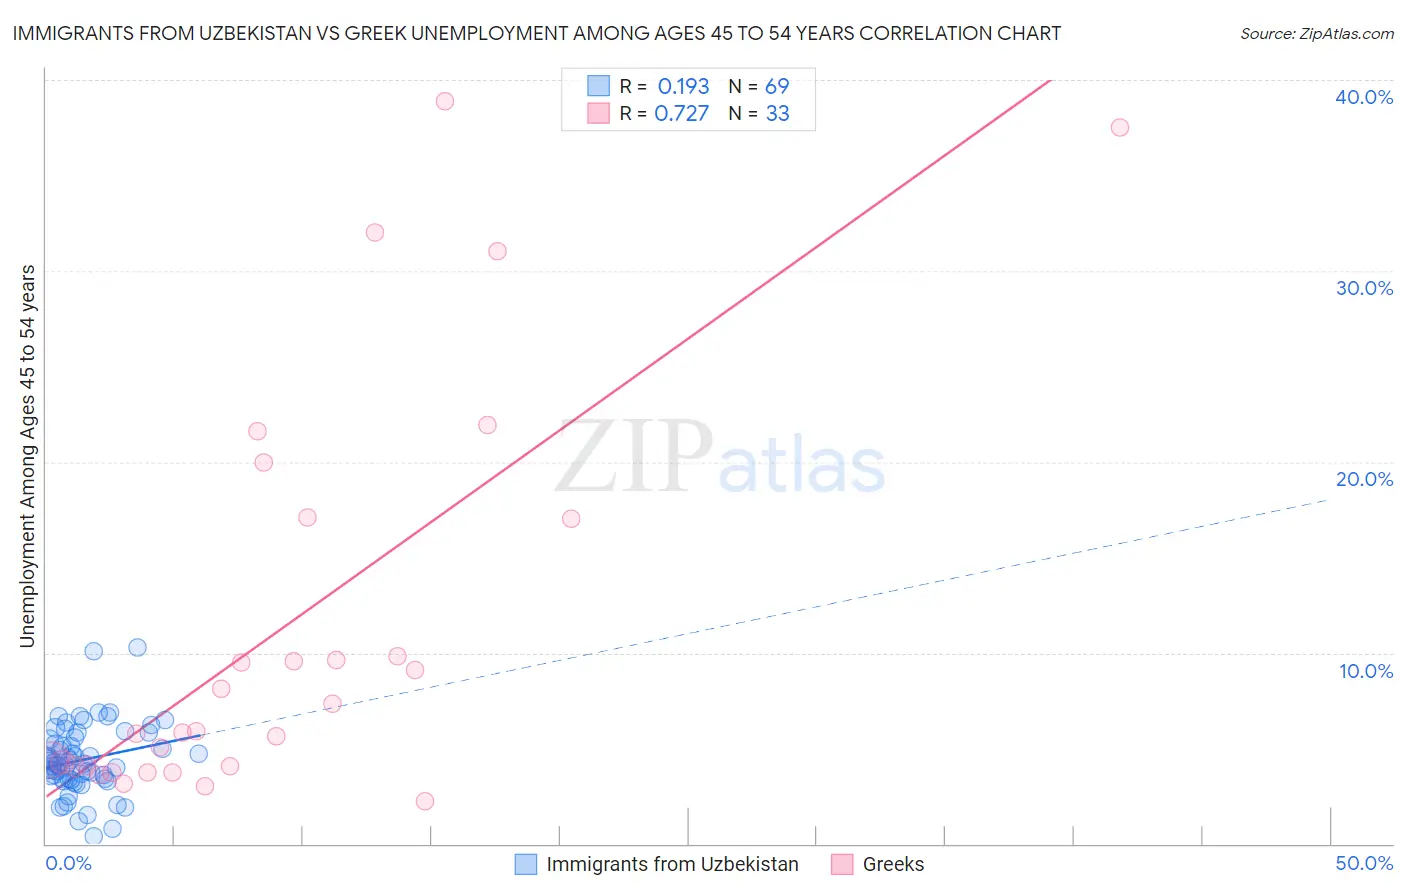
Immigrants from Uzbekistan vs Greek Unemployment Among Ages 45 to 54 years Correlation Chart
The statistical analysis conducted on geographies consisting of 117,964,969 people shows a poor positive correlation between the proportion of Immigrants from Uzbekistan and unemployment rate among population between the ages 45 and 54 in the United States with a correlation coefficient (R) of 0.193 and weighted average of 4.9%. Similarly, the statistical analysis conducted on geographies consisting of 463,102,299 people shows a strong positive correlation between the proportion of Greeks and unemployment rate among population between the ages 45 and 54 in the United States with a correlation coefficient (R) of 0.727 and weighted average of 4.3%, a difference of 15.9%.
Unemployment Among Ages 45 to 54 years Correlation Summary
| Measurement | Immigrants from Uzbekistan | Greek |
| Minimum | 0.40% | 2.2% |
| Maximum | 10.3% | 38.9% |
| Range | 9.9% | 36.7% |
| Mean | 4.4% | 11.3% |
| Median | 4.2% | 5.9% |
| Interquartile 25% (IQ1) | 3.4% | 4.0% |
| Interquartile 75% (IQ3) | 5.5% | 17.1% |
| Interquartile Range (IQR) | 2.1% | 13.0% |
| Standard Deviation (Sample) | 1.8% | 10.5% |
| Standard Deviation (Population) | 1.8% | 10.3% |
Similar Demographics by Unemployment Among Ages 45 to 54 years
Demographics Similar to Immigrants from Uzbekistan by Unemployment Among Ages 45 to 54 years
In terms of unemployment among ages 45 to 54 years, the demographic groups most similar to Immigrants from Uzbekistan are Bahamian (4.9%, a difference of 0.090%), Ghanaian (4.9%, a difference of 0.18%), Immigrants from Somalia (4.9%, a difference of 0.30%), Somali (5.0%, a difference of 0.39%), and Immigrants from Ghana (5.0%, a difference of 0.53%).
| Demographics | Rating | Rank | Unemployment Among Ages 45 to 54 years |
| Guatemalans | 0.1 /100 | #261 | Tragic 4.9% |
| Mexicans | 0.1 /100 | #262 | Tragic 4.9% |
| Immigrants | Fiji | 0.1 /100 | #263 | Tragic 4.9% |
| Immigrants | Guatemala | 0.1 /100 | #264 | Tragic 4.9% |
| Immigrants | Somalia | 0.1 /100 | #265 | Tragic 4.9% |
| Ghanaians | 0.0 /100 | #266 | Tragic 4.9% |
| Bahamians | 0.0 /100 | #267 | Tragic 4.9% |
| Immigrants | Uzbekistan | 0.0 /100 | #268 | Tragic 4.9% |
| Somalis | 0.0 /100 | #269 | Tragic 5.0% |
| Immigrants | Ghana | 0.0 /100 | #270 | Tragic 5.0% |
| Cajuns | 0.0 /100 | #271 | Tragic 5.0% |
| Immigrants | Central America | 0.0 /100 | #272 | Tragic 5.0% |
| Immigrants | Latin America | 0.0 /100 | #273 | Tragic 5.0% |
| U.S. Virgin Islanders | 0.0 /100 | #274 | Tragic 5.0% |
| Bermudans | 0.0 /100 | #275 | Tragic 5.0% |
Demographics Similar to Greeks by Unemployment Among Ages 45 to 54 years
In terms of unemployment among ages 45 to 54 years, the demographic groups most similar to Greeks are Immigrants from Sri Lanka (4.3%, a difference of 0.050%), Okinawan (4.3%, a difference of 0.080%), Immigrants from Jordan (4.3%, a difference of 0.11%), Immigrants from Korea (4.3%, a difference of 0.11%), and Immigrants from Pakistan (4.3%, a difference of 0.11%).
| Demographics | Rating | Rank | Unemployment Among Ages 45 to 54 years |
| Burmese | 99.6 /100 | #51 | Exceptional 4.2% |
| Poles | 99.5 /100 | #52 | Exceptional 4.2% |
| Irish | 99.5 /100 | #53 | Exceptional 4.2% |
| Chickasaw | 99.5 /100 | #54 | Exceptional 4.2% |
| Latvians | 99.4 /100 | #55 | Exceptional 4.2% |
| Immigrants | Jordan | 99.3 /100 | #56 | Exceptional 4.3% |
| Immigrants | Sri Lanka | 99.3 /100 | #57 | Exceptional 4.3% |
| Greeks | 99.3 /100 | #58 | Exceptional 4.3% |
| Okinawans | 99.2 /100 | #59 | Exceptional 4.3% |
| Immigrants | Korea | 99.2 /100 | #60 | Exceptional 4.3% |
| Immigrants | Pakistan | 99.2 /100 | #61 | Exceptional 4.3% |
| Lithuanians | 99.1 /100 | #62 | Exceptional 4.3% |
| Pennsylvania Germans | 99.1 /100 | #63 | Exceptional 4.3% |
| Austrians | 99.0 /100 | #64 | Exceptional 4.3% |
| Immigrants | Sudan | 99.0 /100 | #65 | Exceptional 4.3% |