Immigrants from Uruguay vs Paraguayan Child Poverty Under the Age of 16
COMPARE
Immigrants from Uruguay
Paraguayan
Child Poverty Under the Age of 16
Child Poverty Under the Age of 16 Comparison
Immigrants from Uruguay
Paraguayans
16.8%
CHILD POVERTY UNDER THE AGE OF 16
23.1/ 100
METRIC RATING
194th/ 347
METRIC RANK
14.7%
CHILD POVERTY UNDER THE AGE OF 16
95.7/ 100
METRIC RATING
97th/ 347
METRIC RANK
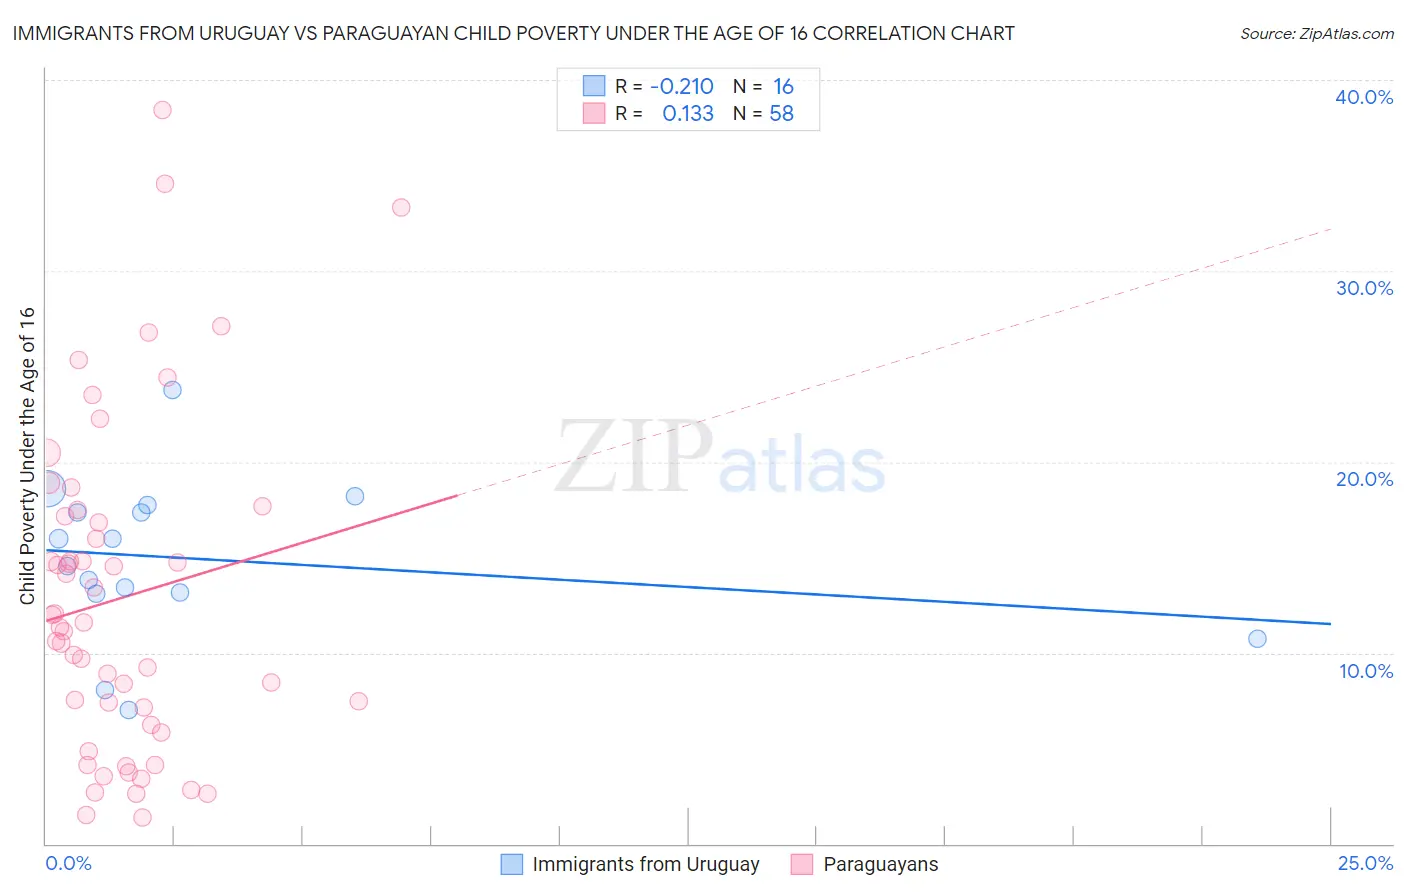
Immigrants from Uruguay vs Paraguayan Child Poverty Under the Age of 16 Correlation Chart
The statistical analysis conducted on geographies consisting of 132,929,464 people shows a weak negative correlation between the proportion of Immigrants from Uruguay and poverty level among children under the age of 16 in the United States with a correlation coefficient (R) of -0.210 and weighted average of 16.8%. Similarly, the statistical analysis conducted on geographies consisting of 94,860,447 people shows a poor positive correlation between the proportion of Paraguayans and poverty level among children under the age of 16 in the United States with a correlation coefficient (R) of 0.133 and weighted average of 14.7%, a difference of 14.2%.
Child Poverty Under the Age of 16 Correlation Summary
| Measurement | Immigrants from Uruguay | Paraguayan |
| Minimum | 7.0% | 1.4% |
| Maximum | 23.8% | 38.4% |
| Range | 16.8% | 37.0% |
| Mean | 14.9% | 12.9% |
| Median | 15.3% | 11.5% |
| Interquartile 25% (IQ1) | 13.1% | 6.2% |
| Interquartile 75% (IQ3) | 17.6% | 17.1% |
| Interquartile Range (IQR) | 4.5% | 10.9% |
| Standard Deviation (Sample) | 4.2% | 8.6% |
| Standard Deviation (Population) | 4.1% | 8.5% |
Similar Demographics by Child Poverty Under the Age of 16
Demographics Similar to Immigrants from Uruguay by Child Poverty Under the Age of 16
In terms of child poverty under the age of 16, the demographic groups most similar to Immigrants from Uruguay are Spaniard (16.8%, a difference of 0.020%), Immigrants from Uganda (16.8%, a difference of 0.090%), Immigrants from Lebanon (16.8%, a difference of 0.17%), Spanish (16.7%, a difference of 0.22%), and Immigrants from Kenya (16.9%, a difference of 0.69%).
| Demographics | Rating | Rank | Child Poverty Under the Age of 16 |
| Arabs | 31.4 /100 | #187 | Fair 16.6% |
| Immigrants | Morocco | 31.2 /100 | #188 | Fair 16.6% |
| Immigrants | Portugal | 30.0 /100 | #189 | Fair 16.6% |
| Immigrants | Costa Rica | 29.6 /100 | #190 | Fair 16.6% |
| Immigrants | Iraq | 28.3 /100 | #191 | Fair 16.7% |
| Spanish | 24.5 /100 | #192 | Fair 16.7% |
| Spaniards | 23.2 /100 | #193 | Fair 16.8% |
| Immigrants | Uruguay | 23.1 /100 | #194 | Fair 16.8% |
| Immigrants | Uganda | 22.5 /100 | #195 | Fair 16.8% |
| Immigrants | Lebanon | 22.0 /100 | #196 | Fair 16.8% |
| Immigrants | Kenya | 19.1 /100 | #197 | Poor 16.9% |
| Delaware | 17.1 /100 | #198 | Poor 17.0% |
| Immigrants | Afghanistan | 15.1 /100 | #199 | Poor 17.0% |
| Immigrants | Cameroon | 14.7 /100 | #200 | Poor 17.1% |
| Immigrants | Uzbekistan | 14.7 /100 | #201 | Poor 17.1% |
Demographics Similar to Paraguayans by Child Poverty Under the Age of 16
In terms of child poverty under the age of 16, the demographic groups most similar to Paraguayans are Immigrants from Belarus (14.7%, a difference of 0.010%), Immigrants from France (14.7%, a difference of 0.12%), British (14.7%, a difference of 0.13%), Immigrants from Croatia (14.6%, a difference of 0.36%), and Dutch (14.8%, a difference of 0.45%).
| Demographics | Rating | Rank | Child Poverty Under the Age of 16 |
| Austrians | 96.9 /100 | #90 | Exceptional 14.5% |
| Immigrants | North America | 96.7 /100 | #91 | Exceptional 14.6% |
| Immigrants | Italy | 96.7 /100 | #92 | Exceptional 14.6% |
| Argentineans | 96.6 /100 | #93 | Exceptional 14.6% |
| Immigrants | South Africa | 96.3 /100 | #94 | Exceptional 14.6% |
| Immigrants | Croatia | 96.1 /100 | #95 | Exceptional 14.6% |
| Immigrants | France | 95.8 /100 | #96 | Exceptional 14.7% |
| Paraguayans | 95.7 /100 | #97 | Exceptional 14.7% |
| Immigrants | Belarus | 95.7 /100 | #98 | Exceptional 14.7% |
| British | 95.5 /100 | #99 | Exceptional 14.7% |
| Dutch | 95.1 /100 | #100 | Exceptional 14.8% |
| Immigrants | Switzerland | 95.1 /100 | #101 | Exceptional 14.8% |
| Romanians | 95.0 /100 | #102 | Exceptional 14.8% |
| Immigrants | Egypt | 94.9 /100 | #103 | Exceptional 14.8% |
| Immigrants | England | 94.8 /100 | #104 | Exceptional 14.8% |